Compressed Air Performance Specialists (CAPS Inc.) is a compressed air consultancy located in Calgary, Alberta. In its most recent compressed air project, the company reduced a 200-hp, multi-compressor system down to a single, 100-hp variable speed drive (VSD) air compressor utilizing 75 hp of compressor energy (kWh), resulting in \$70,000 in annual energy savings.
In this particular project, the client was a worldwide organization with a Calgary facility that produces frozen food products for various large retailers throughout Canada. The facility’s management contacted CAPS Inc. to perform a compressed air performance evaluation (CAPE) for its compressed air system.
A comprehensive, on-site CAPE was performed, followed by a detailed final report. In-depth discussions followed regarding the report’s findings, which included performance data, analysis tables, graphs and drawings. The report provided recommendations and an initial capital equipment budget estimate. It also estimated opportunities for annual energy savings (kWh) within the compressed air system compared to the facility’s existing annual operational costs. From this point, the facility obtained capital equipment and project funding approval, initiating a very successful project.
The facility management involved in this project was onboard and supportive. With their unwavering support, the end results to-date have far exceeded the baseline estimates initially provided, while greater opportunities for energy savings are being continually pursued and achieved.
The Existing Compressed Air System
The original system consisted of three individual, air-cooled, oil-flooded enclosed rotary screw air compressors with dual refrigeration air dryers and limited in-line air filtration units aft of the dryers. This was followed by a singular 200-gallon remote air receiver positioned in front of the plant’s primary 4-inch air header (loop) system. The production floor sub-piping systems were generally undersized and/or had lengthy linear service distances with additional associated issues, such as high Delta P service connections and air management devices for individual production equipment.
The compressed air system operated on a 24/7 basis, with two of the three air compressors running continually, while one of the air compressors (75 hp) ran almost constantly. The air compressor configuration consisted of a 100-hp VSD, a 75-hp and a 25-hp (tank-mounted) rotary screw compressor, which collectively totaled 200 hp connected.
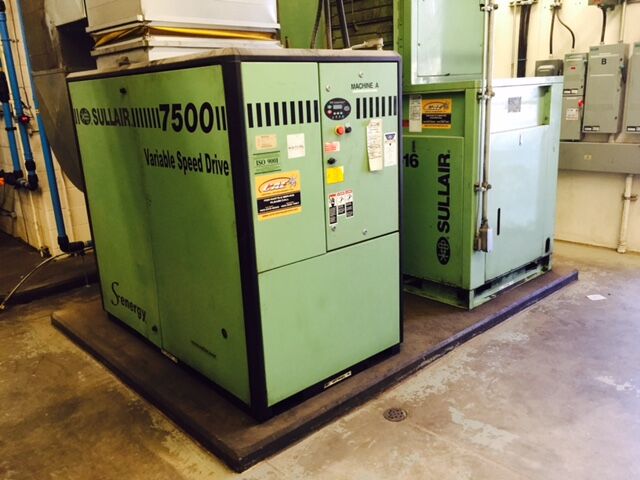
Figure 1: The 100-hp VSD air compressor along with the 75-hp machine.
Operating mode and operating pressure set-points were adjusted in such a manner that two of the three compressors would run constantly, and the remaining 75-hp compressor would automatically stop/start as required via a system low air pressure set-point. However, this auto stop/start capability was generally manually overridden to maintain a final discharge air pressure of 116 psig to the 4-inch air header, which was necessary due to frequent demand events (surges) on the production floor.
High Energy Costs, Inconsistent Air Supply, and Air Quality Issues
The three air compressors annually consumed over 996,000 kWh of energy at a cost of more than \$88,000.00/year, excluding the energy consumption attributed to the dual refrigerated dryers. General day-to-day performance issues included frequent alarm-triggering low air pressure events, frequent demand surge events, and large amounts of oil/condensate contamination downstream in the plant piping system and production equipment. Additional general issues included seasonal high ambient temperatures in the utility/compressor room, and high operating temperature conditions for individual air compressors. Hence, normal operational practice was to run all three air compressors. Finally, no reliable compressed air system performance verification capability excluding the low air pressure alarm device was present in the existing system.
During the extensive on-site period, CAPS Inc. completed the CAPE, including investigation, testing, measurement and data analysis. These investigative procedures included, but were not limited to, the following:
- Installing accurate metering/data logging systems at strategic locations, which simultaneously logged the downstream compressed air demand (cfm), compressed air pressure/temperature, and the compressor room ambient temperature and relative humidity — all in real time.
- Installing individual power meters/loggers to each air compressor’s electrical line side, ensuring all demand and power measurements included both the air-end/exhaust cooling 3-phase drive motors.
- Utilizing highly accurate, multi-orifice flow measurement (acfm) devices for each air compressor’s package discharge air port.
Establishing a Comprehensive Baseline
The CAPS Inc. initial analysis tested and measured each compressor’s acfm output capacity at a baseline of 100 psig, with the same site altitude and temperatures. Simultaneously, during these individual capacity tests, the performance data logging of the 3-phase voltage, current, power factor, and individual 3-phase demand (kW) to each compressor was performed. During each of these full-load performance test periods (acfm at 100 psig), CAPS Inc. also conducted further testing at modulating conditions, varying acfm/psig demands and varying temperatures of ambient inlet compression air and cooling air.
Having attained very accurate individual compressor performance profiles at virtually every operational variable available at that time period (summer), the extensive investigation, observation and overall system performance profiling began with simultaneous data measurement and logging at all key areas, including the entire downstream compressed air system. This lengthy period also included firsthand shift period observations of production equipment, along with other items that required further testing.
The completion of the full CAPE and final report analysis illustrated the following technical information:
The existing three compressors collectively delivered 801.2 acfm at 100 psig full load. This was at a 70°F baseline discharge air temperature with a 172 kW demand line side, equaling 226.3 hp. Normally, the 100- and 25-hp compressors would deliver 530.8 acfm at 100 psig full load, operating at a 70°F baseline discharge air temperature with a 116.3 kW demand (151.6 hp). The remaining 75-hp compressor delivered 270.4 acfm at 100 psig full load, with a 70°F baseline discharge air temperature and a 55.7 kW demand (74.7 hp).
It is important to note that the 100-hp VSD and the 75-hp compressors each had a 3-hp cooling exhaust fan drive motor, while the 25-hp compressor had a direct drive configuration.
Ancillary Air Demand Issues, Pressure Surges, and Air Leaks
CAPS Inc. defines ancillary air demand as follows: “Compressed air volume/demand (acfm) that is not directly associated to manufacturing the product/service, but is used to overcome a production process, function or equipment design deficiency.” Ancillary acfm demand performance testing to four individual ancillary devices/systems verified a range of 84.2 to 116.5 acfm of constant demand. Six additional individual ancillary devices/systems collectively tested and measured a 189.1 to 266.9 acfm intermittent demand range contingent on the number of ancillary devices/systems being utilized. Sanitation air demand volume would fluctuate depending on the period of completion, and would normally equate to 84.6 acfm or greater.
Average weekly air demand was 438.2 acfm at 100 psig. There were also frequent surge events, averaging 650 acfm — with a 700 acfm maximum peak recorded. The surges caused the 75-hp air compressor to come online and assist during all demand events. Weekend periods had partial production and non-production hours, including intermittent sanitation air demands ranging from 150 to 275 acfm. Further testing verified that the system’s air leaks equaled 155.5 to 175.4 acfm, including production equipment, air lines, fittings, valves, tubing, hoses, air control and treatment devices, and other unspecified leaks.
What Caused the Ancillary Demand?
When reviewing the above air leak and ancillary acfm demand values, important clarifications must be indicated to fully understand the relevant factors of the overall compressed air demand (kW) and energy (kWh) consumption. The compressed air leak acfm was indeed an accurately tested and measured value from the facility’s compressed air demand profile. The ancillary compressed air acfm values reflected both the high and low acfm potential of ancillary demand. Examples of potential demand include two production lines having a blow bar, and dual blow guns being utilized to blow off debris from product trays. The blow bar utilized 61.6 acfm during production, and the blow gun application would utilize 90 to 120 acfm, depending on the number of guns in use. Additional examples included a dust collection system that required its filter purge cycles to operate, which consumed 19.9 acfm every 20 seconds (24/7). Electrical cabinet cooling guns also contributed to ancillary demand — with four total units and a constant demand of 23.2 acfm for two units, and 55.5 acfm for all four cooling guns.
Changes to the Compressor Room Improve Energy Efficiency
The following briefly outlines some of the opportunities available and the specific initiatives that the facility pursued to date.
The following improvements were made to the compressor room air system:
- Installed dual 1060 gallon vertical air receivers (wet air receivers-twinned) (Figure 2).
- Installed appropriately sized in-line air filtration assemblies.
- Installed a single, appropriately sized refrigerated air dryer (Figure 3).
- Installed in-line compressed air flow regulator (Figure 4).
- Installed new 63-mm piping throughout the compressor room (Figures 2, 3).
- Utilized both no air loss and timed solenoid condensate auto drains.
- Installed scfm flow and data logging systems.
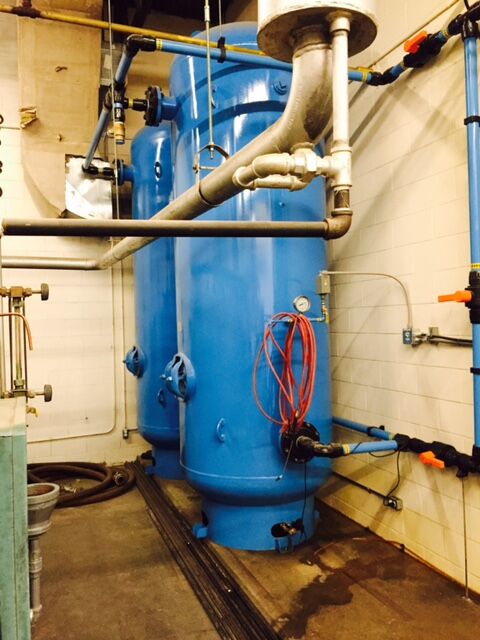
Figure 2: Dual 1060 gallon vertical air receivers with aluminum piping.
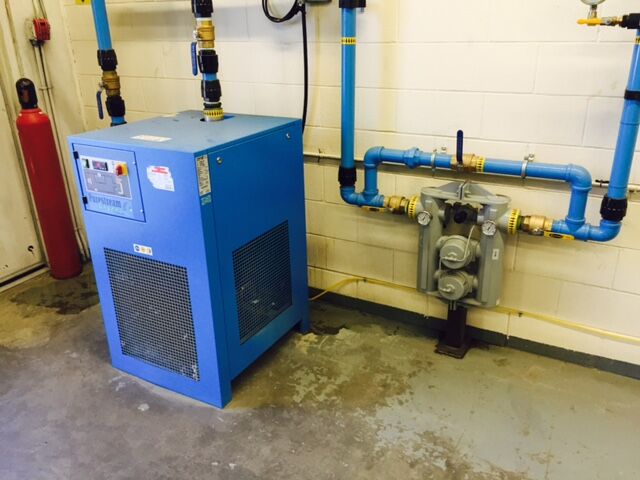
Figure 3: Refrigerated dryer connected to aluminum piping.
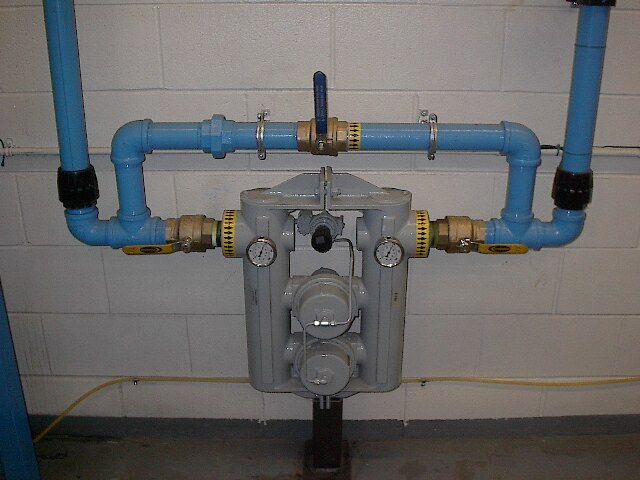
Figure 4: Compressed air flow regulator.
In order to address the compressors’ operating temperatures and the compressor room ambient temperature, the following projects were implemented:
- The 100- and 75-hp compressors’ fresh air inlet/hot air exhaust ducting systems were upgraded and improved. The facility envelope did not need any additional heating capacity.
- Individual fresh air inlet/hot exhaust/warm air mixing louvers with electric actuators for open/close and/or modulating operation were installed for the 100- and 75-hp compressors, ensuring ±513,000 BTUs/hour was ejected outside and 114,000 BTUs/hour was eliminated (25-hp compressor disconnected).
The following changes were made to the compressors:
- Shut off and disconnected the tank-mounted 25-hp compressor.
- Serviced, installed and retrofitted (as required) new control devices for the 75-hp air compressor, complete with operating mode “auto start/stop” and operating pressure set-point adjustments.
- Serviced and adjusted operating mode/pressure set-points to the 100-hp VSD.
System-Wide Improvements Help Reduce and Control Pressure
Other system-wide efforts have started to reduce and eliminate ancillary compressed air demands. A few examples include the redesign and installation of new compressed air product tray debris blow-off nozzle systems. The final acfm air consumption total for both of the two new systems is 28 acfm — a reduction of 62 to 92 acfm. Additional reductions included the shut off of three electrical cabinet cooling guns for more than 35 acfm, and the minimization of dust collector filter cleaning cycles when not needed for a 19.9 acfm reduction.
In addition, the following system upgrades have contributed to the success of the project:
- Installed a new flow controller aft of refrigerated dryer, prior to main 4-inch plant air header with 63-mm aluminum piping throughout the compressor room, connecting to the existing main 4-inch plant air header loop.
- Installed CDI flow meters with LED displays and USB programmable data logging devices.
- An air leak minimization program was initiated, which to-date has an approximate 75-acfm reduction.
- At critical locations, existing undersized schedule 40 sub air service pipes are being upgraded to aluminum 63-, 40- and 25-mm pipe as deemed appropriate.
- Utilized and relocated original 200-gallon air receiver to dust collection system.
- Installed new remote 120-gallon vertical air receiver common to dual product packaging lines.
- Installed additional high flow/low Delta P point-of-use compressed air filtration assemblies.
- Retrofitted/reconfigured several point-of-use compressed air control systems.
- Replaced, upgraded and improved several production areas where existing service line tubing was undersized and/or aged with larger diameter tubing and fittings.
The aforementioned upgrades, retrofits and repairs resulted in significant reductions in air leaks and ancillary demand, while reducing operating pressures at key locations. Additionally, many areas with high Delta P issues have been eliminated. Finally, a significant reduction in compressed air demand during non-production periods is also being experienced, and the system comfortably operates at a primary plant air header pressure of 105 psig.
Making the Return on Investment Tangible
Based on \$0.08/kWh at the time of the original CAPE report, the estimated annual energy reduction for the facility was more than 667,000 kWh — with an estimated \$54,000 to \$61,000 in operational energy savings.
Within a 7-month period, the compressor room project was completed — with several plant production floor projects underway as well. Later projects focused on several point-of-use areas on the production floor, and the positive energy savings continue to increase significantly from the original estimates. In cooperation with facility management and personnel, CAPS Inc. has continued completing plant production floor projects that have the compressed air system’s annual energy savings potentially exceeding \$70,000.
Once again, I would like to stress the importance of having highly motivated management and personnel, as with this facility. The annual opportunities for energy savings affiliated with the compressed air system can be very dramatic, and can also dramatically reduce downtime and significantly improve throughput. For capital equipment and new compressed air line supply/installation, the facility and CAPS Inc. worked with Central Air Equipment (Calgary, AB Canada). Their involvement was also crucial to the success of the project.
For more information, contact Don Dyck, President of CAPS Inc., or visit www.compressedairperformancespecialists.ca.
To read more about System Assessments, please visit www.airbestpractices.com/system-assessments.