A major snack food manufacturer spends an estimated \$148,220 annually on energy to operate the compressed air system at its food processing plant located in the Mid-Atlantic area. As electric rates rise from their current average of 8 cents per kWh, their annual expenditure will only increase.
In this compressed air audit, a group of projects were identified that — when implemented — will reduce these energy costs by an estimated \$40,785 or 28 percent of the facility’s current use. In addition, these projects will help production quality and lower maintenance costs. The estimated costs for completing the recommended projects are about \$185,000, which represents a simple payback period of 54 months.
While the audit comprehensively evaluated the plant and identified energy-saving projects across both the supply and the demand sides of the compressed air system, this article focuses specifically on five of the demand-side projects identified at this food processing plant.
About the Facility’s Compressed Air System
This particular plant has two production lines that produce potato chips. The plant usually operates one to two production lines, depending on the time of year and the production demand.
The facility’s compressed air system is divided into two separate feed lines — one to the plant air and one to the chip transport and nitrogen generation lines. The plant feed is regulated from an average discharge pressure of 87 psig to 88 psig by a Zeks pressure flow controller. The chip transfer and nitrogen systems are fed from the unregulated side of the system, which normally runs from 97 to 105 psig.
The main compressed air supply is provided by two Atlas Copco 125-hp oil-free rotary screw compressors. One is a variable speed drive unit, while the other is a standard two-step controlled unit. An Ingersoll Rand 250-hp two-stage centrifugal is used as an emergency backup. For a look at the full schematic, refer to Figure 1.
Figure 1: The food processing plant’s initial compressed air system

Click here to enlarge
The system has two Ingersoll Rand water-cooled refrigerated dryers to handle the air demand. During the hot summer months, plant personnel operate both of the dryers due to increased condensate migration downstream to production.
The air system operates 8,760 hours per year. Annual plant electric costs for compressed air production are \$141,998 per year. If the electric costs of \$6,222 associated with operating ancillary equipment are included, the total electric costs for operating the air system are \$148,220 per year. These estimates are based upon a blended electric rate of \$0.08 /kWh.
Establishing the Baseline of Compressed Air Use
The following actions were taken to establish baseline measures for flow and pressure (Measurements can be seen in Table 1):
- Temperature readings were obtained on all units using an infrared surface pyrometer. These were observed and recorded to correlate to the unit’s performance, load conditions and integrity.
- Critical pressures, including inlet and discharge, were measured with single digital calibrated vacuum and pressure test gauges with extremely high degree of repeatability.
- Trended data was measured with plant/corporate kW meters, and trended data was sent to data loggers set for 30-second data points for two days for diagnostics. It was sent again at 70-second data points for two weeks for longer averaging.
- Two-step controlled compressor operating performance was calculated as a percentage of full load capacity by identifying the total time at full and no load. The percentage of full load in acfm was then calculated to arrive at a very accurate average peak and minimum flow demand over time.
- The same basic measurement and logging activity was carried out for system pressure, using self-contained pressure transducers and loggers. These units are all calibrated to a single test gauge, and each is set to start logging pressure simultaneously. This delivers an accurate operating pressure profile.
Table 1: Key Air Measurements of the Current System
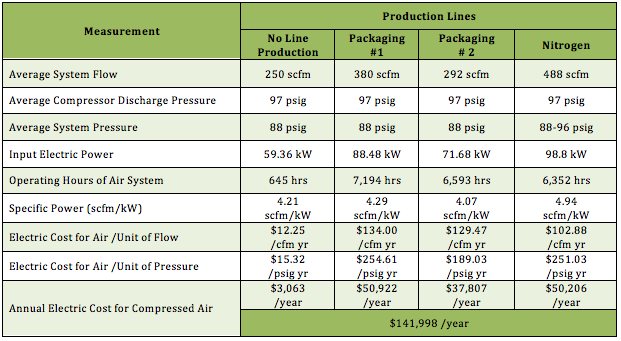
*Based upon on a blended electric rate of \$0.08 per kWh and 8,760 hours/year.
Demand-Side Projects for Improving Energy Efficiency
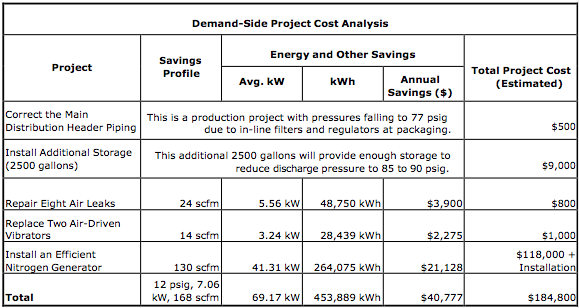
In the following section, five of the demand-side projects that were identified during the audit are described. Collectively, these projects have the potential to save the company \$40,777 annually on energy costs associated with the compressed air system.
1. Correct the Packaging Header Piping
It is the job of the main header system to deliver compressed air from the compressor area to all sectors of the plant, with little or no pressure loss. If there is a significant pressure drop anywhere, then corrective actions are likely needed. A pressure loss of no more than 1 to 2 psid is a reasonable target for main header performance.
It is also desirable that the compressed air velocity in the main headers be kept at below 20 fps to allow effective drop out of contaminants at pre-determined drain points and to minimize pressure losses through excessive turbulence. The magnitude of the turbulence effect depends on the compressed air velocity, piping configuration and pipe size.
Typical header projects include adding pipe, replacing pipe with large diameters, re-orienting or re-directing airflows, and sometimes creating oversized “collector” or “storage” headers.
During the audit, the headers were logged simultaneously at appropriate points with multiple calibrated transducers. In the current system, there is an apparent pressure loss of 1 to 2 psig. The header system can apparently deliver the required air to any area without any significant pressure loss. If low-pressure problems are encountered, they are likely caused by the feeds from the header to the packaging area or extra, marginally applied filters and/or regulators in the lines to the processes.
Therefore, the first part of this project was to correct the main distribution header piping in the packaging area of the plant by removing the filters and regulators on two, 2-inch sub-headers. Those sub-headers were feeding multiple packaging lines, and were experiencing random, low-pressure problems at full loads.
The other part of this project included completing the loops between the ends of all four of the sub-headers. The potato chip packaging lines each have two, 2-inch sub-headers that are fed from one end and are a dead head at the other. Completing the loop allowed these headers to be fed from a different direction when needed. This piping project created two loops within the bigger loop.
The combined projects eliminated the excessive operating pressure loss.
2. Install Additional Air Storage to Lower Plant Pressure
The air system will be most efficient if it uses the lowest possible flow and the lowest effective pressure. Therefore, pressure regulators can be leveraged to effectively use the air receiver capacity and sustain a stable airflow in the system at the lowest effective pressure with varying demands. This avoids pressure spikes that can create increased flow to all unregulated air uses.
Plant personnel have already installed a Zeks flow controller on the distribution header — between the compressor room and production area — which delivers the compressed air at 87 to 88 psig. The product transfer and the nitrogen generator are fed from a line before the flow controller at a higher pressure (normal 97 psig). The current control band is approximately 1 to 2 psi at the flow controller discharge. We measured 87.7 psig at the packaging header, and other locations had similar readings. This would indicate the main distribution header system is capable of handling the demand of the plant to the production areas.
The process at the pneumatic transfer has a short duration and a high peak flow of 427 scfm over 2.25 minutes. This results in a “rate of flow” of 190 scfm during the period. The cycle time between peak surges is 15 minutes. The current storage pulls down 25 psig during the 2.25-minute run.
This establishes an effective “buffer” for typical air demands in the PSA nitrogen generator and pneumatic transfer lines.
There is 4200 gallons of storage to handle this cycle rate of flow, which eliminates excessive pressure fluctuation. In order to effectively lower the plant pressure while covering peak demands, an additional 2500 gallons of effective shortage is required to hold the losses to the desired levels. The desired level is 15 psig, which will allow the air compressors to run at a lower pressure.
Establishing the Net Flow into the Receivers
Calculating net flow out: Time = (volume) (P2-P1) / (Net Flow) (14.5)
2.25 = 561 (95-70) = 14,025 = 427 scfm net flow out
NF (14.5) 32.85
Storage calculation for lower system pressure:
2.25 = Vol. (85-70)
427 x 14.5
2.25 = Vol. (15) = 13,930 = 928 cu ft. x 7.48 (gal/ft3) = *6941 – 4200 gal. = 2741 gal.
427 x 14.5 15
*Storage required to hold a maximum pressure loss of 15 psig (4200 is the current storage, and 2741 gal. is the additional storage required).
Pump up time current storage:
8 minutes Tpu = 516 cuft (25) = 12,900 = 111 scfm
NF (14.5) 116
Pump up time recommended storage:
Tpu = 928(15) = 13,920 = 8.65 minutes
111(14.5) 1609
The future refill rate for the new storage capacity will increase from 8 minutes to approximately 8 minutes and 39 seconds.
Thanks to the additional storage, the flow controller can operate effectively, maintaining consistent plant pressure at 85 psig.
3. Implement a Leak Identification and Repair Program
Most plants can benefit from an ongoing air leak management program. Generally speaking, the most effective programs are those that involve the production supervisors and operators working in concert with the maintenance personnel. Accordingly, it is suggested that all programs consist of the following two phases:
- Short-Term Program: Set up a continuing leak inspection program for maintenance personnel so that each primary sector of the plant is inspected once each quarter to identify and repair leaks. A record should be kept of all findings, corrective measures and overall results.
- Long-Term Program: Consider setting up programs to motivate the operators and supervisors to identify and repair leaks. One method that has worked well with many operations is to monitor/measure the airflow to each department and make each department responsible for identifying its air usage as a measurable part of the operating expense. This usually works best when combined with an effective in-house training, awareness and incentive program.
Shutting off or valving off the air supply to the identified leaks when the area is idle would save significant energy use from leaks. Reducing the overall system pressure would also reduce the impact of the leaks — when air to the machine cannot be shut off. Repairing the leaks can save additional energy. The estimated savings associated with a leak management program are based on the unloading controls of the compressors being able to effectively translate less airflow demand into lower cost.
Air Power USA recommends an ultrasonic leak locator be used to identify and quantify the compressed air leaks. With a few minor exceptions, most of the leaks in this audit could not have been found without the use of an ultrasonic leak detector and a trained operator. Locating leaks during production time with the proper equipment is very effective and often shows leaks that are not there when idle. However, a regular program of inspecting the systems in “off hours” with “air powered up” is also a good idea. In a system such as this one, some 80 to 90 percent of the total leaks will be in the use of the machinery, not in the distribution system.
4. Replace Air-Driven Vibrators with Electric Units
Air vibrators are used to keep product or packaging moving or separated (e.g. keeping lids separated prior to sealing). If a plant employs air vibrators that use about 10 cfm each, they will require about 2.5 hp or more to produce the same as a similar electric vibrator, which might use about 0.25 hp of input energy.
By simply replacing two of the plant’s air-driven vibrators with electric units, this facility could reduce its annual costs by \$548.00 (Figure 2). In general, air vibrators can almost always be replaced with electric vibrators, except in foundry sand mold operations.
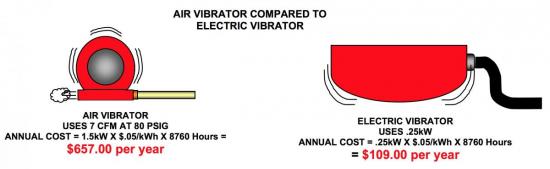
Figure 2: The annual costs of air-driven vibrators are significantly greater than that of electric vibrators.
5. Improve the Efficiency of the Nitrogen Generation System
In this plant, nitrogen is used to purge the ambient air from the packaging bags before they are filled and sealed. When the lines are not running, the nitrogen generator is shut down. This particular plant uses a PSA nitrogen generator (purge oxygen) to produce its nitrogen on-site. This facility’s original perceived purity requirement was 99.999 percent.
Nitrogen generation and its purity are dictated by the flow and pressure of the compressed air, and you can control the cost of nitrogen by controlling the volume and pressure of the compressed air. When you use more purity than you need, the compressed air costs are higher. Therefore, it is important to understand the required purity of nitrogen, since that dictates the flow and pressure of compressed air. You should also know the ratio of compressed air to nitrogen for each type of generator to meet the required nitrogen flow, pressure and purity.
Purity requirements for nitrogen in packaging vary with the product itself and the expected “shelf life.”
Table 2: Cost Analysis of the Demand-Side Projects
The facility’s original PSA nitrogen generation system produced 1 scfm of nitrogen for every 4.4 scfm of compressed air at 95 psig inlet pressure. The generator switches every minute, and the compressed air flow rate is based on the nitrogen demand. Consequently, it will vary with the number of production lines running.
Investigation by plant engineering and production personnel determined that 98.6 percent nitrogen purity would be a more optimal requirement. With this information, plant staff and Air Power personnel worked with several vendors and identified a PSA unit that could supply the required nitrogen flow with 85 psig inlet pressure, delivering a consistent purity of 98.7 percent.
The new system delivers 1 cfm of nitrogen for every 2.5 cfm of compressed air. This is a 56 to 57 percent reduction in air volume. Combined with the increased storage project, it allows a significant reduction in compressor discharge pressure (8 to 9 psig), providing an energy reduction of 4 percent of the total inlet power.
For more information, contact Hank van Ormer, Air Power USA or visit www.airpowerusainc.com.
To read more about System Assessments, please visit www.airbestpractices.com/system-assessments.