Introduction
Annual plant electric costs for compressed air production, as operating today, are \$141,998 per year. If the electric costs of \$6,222 associated with operating ancillary equipment such as dryers are included the total electric costs for operating the air system are \$148,220 per year. These estimates are based upon a blended electric rate of \$0.08 /kWh.
This plant has three production lines producing snack food. Depending on the time of year and production demand the plant can operate anywhere from no production lines to all three production lines.
A thorough supply and demand-side system assessment was done at this plant. Due to article space constraints, this article will focus on some recommended demand-side reduction projects including nitrogen generation, air vibrators, leaks and vacuum venturis.
Supply-Side Overview: Air Compressors and Dryers
The air compressors have all operated reliably and have met expectations. There are two Atlas Copco, water-cooled, oil-free, rotary screw air compressors producing the compressed air for the system demand. One is a model ZR 90,125-hp class (132 bhp) producing 511 scfm at full load and equipped with a 2-step unloading control. It is used as a base load compressor when needed for higher production levels.
The second Atlas Copco model ZR 90 VSD, 125 hp class (142 bhp) produces 503 scfm at full load. This variable speed drive (VSD) air compressor is used as a trim compressor, when high production levels occur, and as a base load unit during lower production periods. This air compressor seldom reaches full load during lower production levels.
The plant also has an Ingersoll-Rand model 1CV12M2, 250-hp class, 2-stage, water-cooled, centrifugal air compressor used as emergency backup or when the Atlas Copco compressors need service or repair.
The system has two Ingersoll-Rand model DXR 1250, water-cooled, refrigerated dryers to handle the air demand. During the hot summer months, plant personnel operate both of the dryers due to increased condensate downstream found in production areas.
Table 1: OEM Engineering Data for Existing Air Compressors
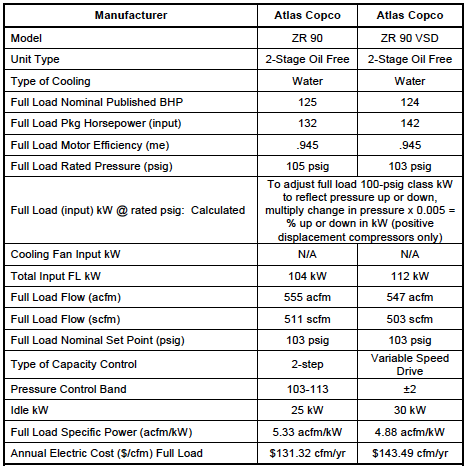
Based upon blended electric rates of \$0.08 per kWh and operating 8,760 hours per year.
The Compressed Air System
The compressed air system is divided into two separate piping feed lines, one going to Plant Air and one to the Corn Transport and Nitrogen Generation areas. The Plant Air feed is regulated from an average discharge pressure of 97 psig to 88 psig; using a Zeks model 30X PC00 flow controller. The Corn Transfer and Nitrogen system are fed from the unregulated side of the system.
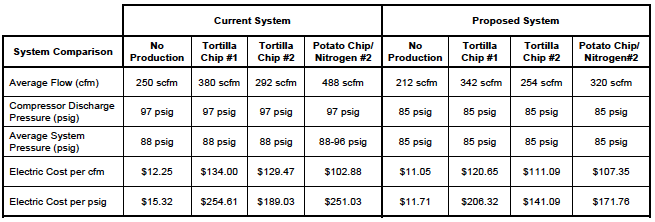
The compressed air system operates 8,760 hours per year. The load profile or air demand of this system is not stable during different production lines. The system pressure runs from 95 psig on the Nitrogen and Corn Transfer area to 87 psig in the headers during production - except on the Tortilla Chip packaging line due to inline regulators and filters in the sub header.
Table 2: Compressed Air and Nitrogen Use of Three Production Lines
The Nitrogen Generation Area
The lines with the largest compressed air demand are the Corn Transport and the Nitrogen generation PSA unit.
The Nitrogen is used to purge the ambient air from the packaging bag before the chips are filled and sealed. The current Nitrogen generation system is a Parker / Balston PSA model DB8000- 0.5, which produces one scfm of Nitrogen for every 4.4 scfm of compressed air at 105 psig. The generator switches every minute and the compressed air flow rate is based on the Nitrogen demand and will vary with the number of production lines running. Liquid Nitrogen is supplied as make up if the generator cannot meet system demands.
N2 is used on the Potato Chip bagger systems and not for the Tortilla Chip lines. When there is no Potato Chip line running, the Nitrogen generator is shut off.
Plant personnel plan to install a new Nitrogen generator Parker model DB9000-B0503, which requires 383 scfm of compressed air at 85 psig to produce up to 150 scfm of Nitrogen. This newer generation nitrogen generator is more efficient and will help reduce the compressed air demand and have a more stable Nitrogen supply.
The increase in nitrogen generation efficiencies over the last decade have made on site generation even more effective compared to off-site generated supplies. Like many new trends, on site generation systems are frequently installed without full awareness of what the true operating cost is or what it could be. The major operating cost of on-site generated nitrogen is the compressed air.
- Nitrogen comes from air
- On-site nitrogen generation comes from compressed air through:
- PSA Adsorption of nitrogen (purge oxygen)
- Membrane Separation (purge oxygen)
- When you use more nitrogenpurity than required, compressed air costs are higher.
The most significant operating energy cost is the delivery of the compressed air:
- Compressed air is energy expensive: 8-hp of electricity produces only 1-hp of work with compressed air
- Controlling the cost of nitrogen is controlling the volume and pressure of compressed air needed
- Important information required
- #1 - Purity of N2 requirement determines flow and pressure
- #2 – Know the ratio of CA/N2 for each type of generator to meet identified N2 flow, pressure and purity
- The most common nitrogen purity specification is 99.999% -- safe for production, but expensive to generate.
✅ RECOMMENDED PROJECT (#1)
Install new more efficient Nitrogen Generator to reduce the compressed air to nitrogen ratio from (4.4 to 1) to (2.5 to 1).
| Current compressed air usage | 300 scfm |
| Estimated compressed air usage with more efficient generator | 170 scfm |
| Estimated compressed air savings | 130 scfm |
| Total energy recovery project | $21,128 per year |
Artificial Demand Background
The air system will be most efficient if it uses the lowest possible flow and the lowest effective pressure. Therefore, pressure regulators can be used to create effective use of the air receiver capacity and maintain a stable air flow in the system at the lowest effective pressure. This avoids pressure spikes that can create increased flow to all unregulated air uses with no increase in productivity.
Artificial demand is air demand generated by excessive pressure or system overdrive that does not enhance productivity or quality. Other benefits of a “controlled system” include:
- Production should find a constant, steady pressure conducive to stabilizing demand and increased productivity. A steady, fixed pressure may also increase the quality of production runs by fixing the repeatability standards.
- Once the system is stabilized and the flow and pressure are controlled, plant personnel can experiment to find the lowest effective pressure, which will optimize flow demand.
- Properly sized demand-side control receivers and controllers may often carry a peak demand event over its operating time span without turning on or loading another compressor. Storage to cover certain identifiable larger demand “events” should be sized by calculation to cover the additional flow. Once sized, the decision will have to be whether to install the required storage in the compressor room or near the process.
Effect of Lower Pressure on Unregulated Flow
A plant’s level of unregulated flow of 500 cfm at 100-psig pressure will automatically be reduced approximately as shown below for alternative pressure levels. This reduction is known as eliminating artificial demand or system overdrive. Sample savings include:
- Pressure reduction to 95 psig saves 25 cfm or 5 HP
- Pressure reduction to 90 psig saves 50 cfm or 10 HP
- Pressure reduction to 85 psig saves 75 cfm or 15 HP
- Full networking control systems and variable speed drive controls will also deliver a steady pressure to any system whose demand does not exceed the supply – this performance is not storage dependent
Current Application
Plant personnel have already installed a Zeks model 30X PC00, on the distribution header from the compressor room to production area, wet to 88 psig, the corn transfer and the Nitrogen generator are feed from a line before the flow controller. The current float is approximately 1 to 2 psi at the flow controller. We measured 87.7 psig at the PC packaging header and in other locations were similar in readings. This would indicate the main distribution header system is capable of handling the demand of the plant.
Storage Used to Convert High Peak Flow to Low Average Flow
The process at Corn Transfer has a short duration and a high peak flow of 427scfm over 2.25 minutes. This results in a “rate of flow” of 190 scfm during the period. The cycle time between peak surges is 15 minutes. Currently the plant has installed 4,200 gallons of receiver storage to handle this demand with a 1⁄4” orifice in the supply line to slow the refill rate of the receivers. In part, the projects listed are to lower the compressor / header discharge pressure from 90 to 85 psig. Additional storage will be needed to cover the peak demand with the lower pressure. An additional 2,500 gallon class receiver will need to be installed.
Establishing the Net Flow into the receivers during the process:
Pump up formula: Time = (volume) (P2-P1) / (Net Flow) (14.5)
2.25 = 561 (95-70) = 14,025 = 427 scfm NF (14.5) 32.85
Storage calculation for lower system pressure:
2.25 = Vol. (85-70) = 13,930 = 928 cu ft x 7.48 (gal/cu. Ft) =
427 x 14.5 15
= 6,941 gallons – 4,200 = 2,741 gallons
Pump up time current storage:
8 minutes Tpu = 516 cuft (25) = 12,900 = 111 scfm
NF (14.5) 116
Pump up time recommended storage:
Tup = 928(15) = 13,920 = 8.65 minutes
111(14.5) 1609
The future refill rate for the new storage capacity will increase from eight minutes to approximately eight minutes and thirty nine seconds.
✅ RECOMMENDED PROJECT (#2)
Install a 2,500 gallon class air receiver in the Corn Transfer area, tie into existing 4,200 gallon storage. This additional 2,500 gallons will provide enough storage for the process at the lower pressure of 85 psig.
Compressed Air Leak Survey
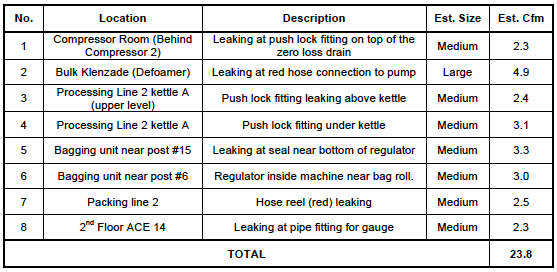
A partial survey of compressed air leaks was conducted at the plant and 8 leaks were identified, quantified, tagged, and logged. Potential savings totaled 24 cfm.
| Number of leaks | 8 leaks |
| Estimated reduction of air flow with proposed project | 24 cfm |
| Recoverable savings from air flow reduction | $162.51 per cfm per year |
| Annual electric cost savings with proposed project | $3,900 per year |
| Unit cost of leak repairs ($25 materials per leak and \$75 labor per leak) | $100 |
| Total project cost (materials and installation) | $800 |
Table 3: Compressed Air Leak List
✅ RECOMMENDED PROJECT (#3)
Fix Compressed Air Leaks
Centralized Vacuum Supplies Box Erector and Packaging Area
According to plant personnel, all of the Venturi vacuum generators in the plant have been replaced with a central vacuum system. There are six Busch models MWK 1142 variable speed pumps, located in the Box Room.
This system is more efficient than an uncontrolled air driven Venturi vacuum generator, which is what the box erector machines had been supplied with from the OEM. In general, if there is a large central vacuum system already in place and running with excess capacity, tying the vacuum generators requirement to it will probably generate energy savings.
Vacuum generators are selected for more localized or “point-of-use” vacuum applications that require smaller volumes and faster local response times. Manufacturers of production machinery often supply them as standard equipment. There are two basic types of ejector pumps: single-stage vacuum generators and multi-stage vacuum generators.
Single-stage vacuum generators use compressed air by accelerating the air through the restrictor tube to create a Venturi effect to evacuate the required volume of air. These single- stage Venturi generators are somewhat limited in their ability to fit many applications efficiently, since their basic design is set to accommodate either the highest flow or highest volume requirement. Typically, this type of vacuum generator has a ratio of compressed air consumption (scfm) to vacuum flow (the rate at which atmospheric pressure is removed from a system) of no better than 1:1 and sometimes as high as 2:1 or 3:1.
Multi-stage vacuum generators were developed to improve this efficiency for many applications. The multi-stage units use a series of ejectors and nozzles that allow compressed air to expand in controlled stages. This usually improves the ratio of compressed air consumption to vacuum flow to a level of up to 1:2 or more. Multi-stage units are also quieter.
The compressed air exits the smaller first pump nozzle creating a low pressure area at that stage. This low pressure creates a Venturi, pulling in the evacuation air through the ports. This evacuated air is mixed into the compressed air flow. This action continues over succeeding stages. The flapper valve allows the compressed air to flow through the pump nozzles and not back into the vacuum.
In general, vacuum generators:
- Use compressed air whenever they are on
- Use less air and are more efficient when in a multi-stage configuration than they are as single-stage units under certain loads
- Need to be carefully chosen – selecting the right pump for each specific application is not always easy
- Are probably not the right approach when a large and/or continuous volume is called for
- Will use a significant amount of compressed air when pulling a lower vacuum
- Will waste a significant amount of compressed air when pulling a vacuum at any time it is not required for production
- May be less economical than a “central mechanical” pump when there are a significant number of vacuum generators used in a single area.
Vacuum generators are very convenient and very responsive, but may be less efficient as applied compared to larger positive displacement pumps (e.g., larger rotary screw, vane, or reciprocating pumps), which may be the better choice when conditions require large flow, and allow potentially slower response time. They also may be very, very efficient and effective.
Energy cost escalates as the vacuum level goes down with Venturi generators, so it is very important to only run a Venturi vacuum generator at the minimum vacuum level (psia), minimum acceptable “on time” cycle, and at the lowest effective compressed air pressure. Properly applied, Venturi generators can be very power efficient and can enhance productivity.
Air Vibrators
Air vibrators are used to keep product or packaging moving or separated – e.g., keeping lids separated prior to sealing. If a plant employs air vibrators that use about 10 cfm each, they will require about 2.5 hp or more to produce the same as a similar electric vibrator, which might use about 0.25-hp input energy.
Air vibrators are used to keep product or packaging moving or separated – e.g., keeping lids separated prior to sealing. If a plant employs air vibrators that use about 10 cfm each, they will require about 2.5 hp or more to produce the same as a similar electric vibrator, which might use about 0.25-hp input energy. Air vibrators can almost always be replaced with electric except in foundry sand mold operations.
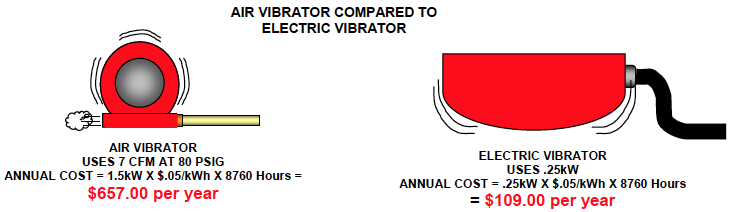
✅ RECOMMENDED PROJECT (#4)
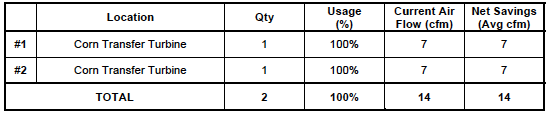
Replace two (2) air driven compressed air vibrators with electric units.
| Compressed air used currently | 14 cfm |
| Reduction in compressed air usage | 14 cfm |
| Recoverable savings from air flow reduction | $162.51 cfm/yr |
| Total energy recovery project | $2,275 per year |
| Estimated cost of project | $1,000 |
For more information on APenergy visit apenergy.com or call 740.862.4112.
To read more about Compressed Air System Assessments please visit www.airbestpractices.com/system-assessments.