The audited facility is one of the larger office furniture manufacturers in the Midwest. The facility manufactures metal frames for desks, chairs and cabinets. The large powder coating system represents a key competence in the manufacturing process of this facility.
The management of the facility requested the compressed air audit to document/simulate the potential savings generated by the suggested improvements from a compressor dealer. The facility has an established leak detection routine and the review of the demand side (of the compressed air system) was not a part of the scope of this audit.
The facility generates compressed air with six (6) air compressors of various sizes located in three different compressor rooms. In recent years, the entire system converted to desiccant air dryers. Available equipment from other facilities has been utilized. The following is the layout of the facility showing the locations of the compressor rooms.
System parameters
The facility operates on two shifts; first and third shift. The powder coating system needs compressed air 24/7. Annually the compressed air system operates 8,760 hrs. The blended rate for electricity, to be used in this audit, was received from their accounting department and is 8 cents/kWh.
Data Loggers
Data loggers with AMP CT’s were placed on all the compressors. Each compressor was tested for voltage and actual kW with a power meter to determine power factor in load and unload conditions. The AMPs of each compressor has been recorded on a one second interval and averaged over 10 seconds to manage the data volume. Data loggers have been installed in each compressor room to log the pressure. A dew point meter has been installed in the center of the facility.
During the walk through it was discovered that all the desiccant air dryers are purging - even when the compressors are not running. We decided to monitor the cycling behavior of the dryers. It is noteworthy that the desiccant dryer for the compressor #3 has more than twice the capacity of the compressor. When asked for the reason, we have been informed that the dryer arrived from another facility and didn’t cost them anything.
The Demand Profile
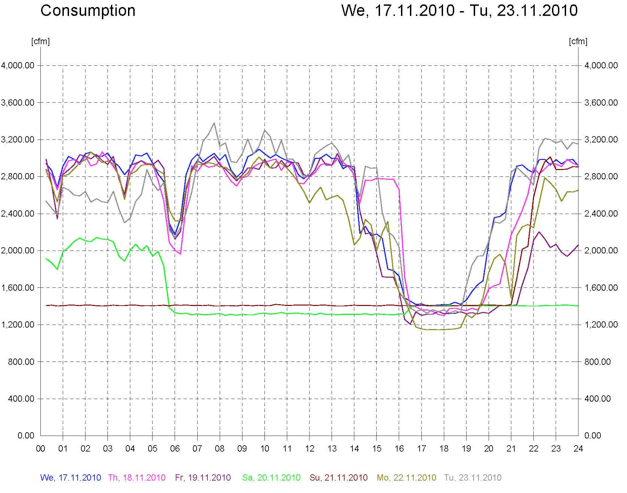
The base demand in the plant is about 1,300 cfm with peak demand being 3,431 cfm. Minimum demand was measured at 1,085 and average 2,231 cfm. The flow chart also depicts similar demand patterns with the 6 AM to 3PM and 9 PM to 6 AM shifts in the plant.
Table 1. Compressed air system equipment list
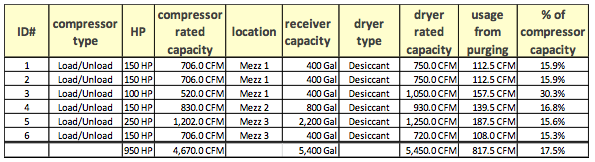
Image 1. Measured Demand Profile
Compressed Air System Performance Overview
The annualized cost to run the system is \$288,611 with an unload share of 12.7% or \$ 36,813.
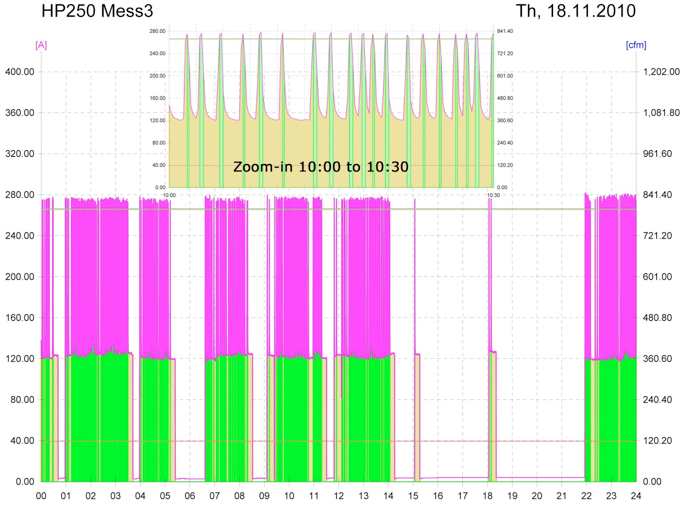
During this audit, it was noted that the largest compressor, #5 has the highest unload share whereas the smallest compressor has the lowest unload share. When reviewing the details of the compressor #5, it was detected that the compressor starts but was restricted to run. The restriction had two reasons; one, the pressure set points of this compressor have been the lowest of any of the compressors and, two, the filter had a flow restriction.
The graph in Image 2 shows the performance of this compressor #5 over a day. The zoomed-in graph between 10:00 and 10:30 shows that the compressor does not produce any compressed air. It fills the sump-pump reservoir, the piping and the wet-receiver, but does not really add any compressed air into the overall system. The majority of the produced compressed air from compressor #5, which accumulated to 1,063,750 CF, is lost in blow down. This alone accounts for energy cost of \$ 542 per week or \$28,286 per year.
The system pressure, particularly when the large compressor #5 came online, bottomed out at about 85 PSI and the highest pressure recorded during the audit was 111 PSI. The system average pressure during audit was calculated to be 98 PSI.
Table 2. Compressed Air System Data
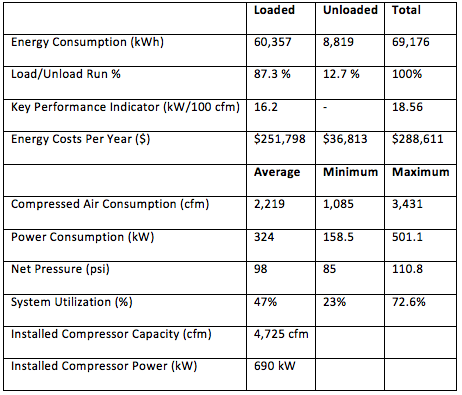
Image 2. Zoom-in of Compressor #5 Performance
The overall storage of the system is 5,400 Gallons. This is considered a low volume given the size of the system and the demand dynamics. Of great concern is the fact that all storage is wet storage. Dry storage would help this installation. It is highly recommended to remove the moisture before the compressed air arrives at the dryers, which is done with the wet-receivers in this case. However, there is no storage to handle demand spikes in the facility. Also, the large air demands to purge the desiccant dryers cannot be balanced.
Image 3 visualizes the compressor running times in load (green) and unload (yellow) conditions in the upper graph. The Lower graph depicts the dryer cycling. Only the dryer on compressor #1 (circled in red) is demand based (dew point controlled) whereas all the others are time based. (cycling every 5 minutes).
Image 3. Compressor and Dryer Load Profiles
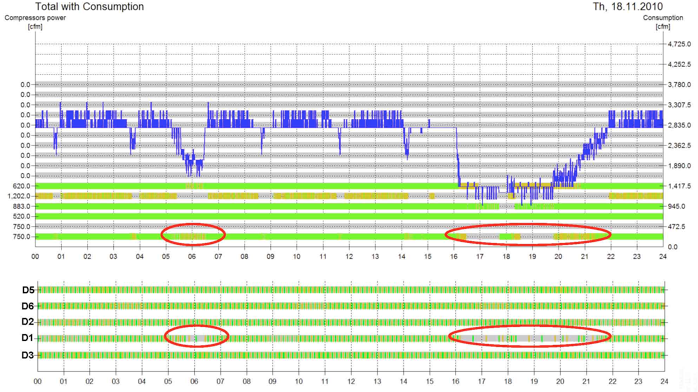
It is noted that the smallest 100 HP compressor, #3 with the desiccant dryer (which has been obtained from a sister plant) costs over \$20,000 to operate per year. It is with good intention to use used equipment, but as in this case, it can come with a high energy bill. A correctly sized desiccant dryer for compressor #3, even with time based control, would use half of the energy.
During the audit, it was discovered that the desiccant air system has been installed mainly to reduce moisture in the facility that was causing problems with the powder coating system. During the installation of the data logger, we also checked the wet receiver tanks and found substantial amounts of condensate in one of the tanks.
The powder coating system was also inspected. After contacting the manufacturer, we learned that the powder coating system has the following requirements:
The pressure dewpoint of the compressed air being provided must be 38˚F or lower at 100 PSIG (this can be achieved by refrigerated dryers)
Table 3. Calculated annualized cost for the desiccant dried air.
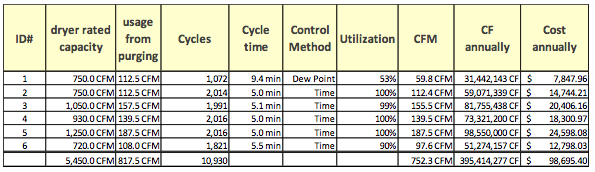
The majority of the condensate drains in the system are time-based drains. The hot and humid summers in the Midwest can result in more than 10-times higher condensate accumulation as in winter time. However, in this facility, the timer on the drains were not seasonally adjusted - resulting in accumulated condensate in the receiver tanks.
We suspect that a well-monitored zero airloss condensate system could have avoided the installation of the desiccant dryers. The \$98,685 annual energy cost of operating the desiccant dryers accounts for more than 1/3 of the overall energy cost of the system. The estimated cost to run a refrigerated dryer system is about five percent of the cost to run the desiccant air dryers - or \$15,000.
Common Desiccant Compressed Air Dryer Sizing Errors - Webinar RecordingDownload the slides and watch the recording of the FREE webcast to learn:
|
Compressed Air System Simulation Based Upon Existing Parameters
A system simulation was performed with a calculated savings of \$ 54,000 resulting from the master control alone. In addition, the zero air-loss drains and the retrofitted dryers will generate additional savings.
Suggested improvements:
1) Install Master Control
A central master control will assure the best use of the compressors and that the smaller compressors are running as the trim compressors. The system also has an energy management component, with energy metering at each compressor and the capability to continuously record system data. Therefore, future energy efficiency projects can be calculated, verified and documented for the utilities.
2) Increase Storage Capacity
It is recommended to add a minimum of 5 Gal/cfm of dry storage to the compressed air system. Based on the 3,500 cfm peak usage, the minimal suggested receiver capacity is 17,500 Gallons. Subtract the existing 5,400 Gallons and this results in an additional receiving capacity of 12,000 Gallons.
3) Install Zero Air-loss Drains
It is recommended to install Zero air-loss drains with contacts. The contacts are utilized to connect to the master control in order to send e-mail alerts in case of drain failure.
4) Compressed Air Dryer System improvements
A management requirement is to have desiccant dried air for the powder coating system. So the following alternatives have been presented.
a. The compressed air used for the powder coating systems represents between 20-25% of total air usage. Therefore, we recommend replacing desiccant dryers system with refrigerated dryers to provide the plant compressed air and install a dedicated desiccant dryer at the powder coating system.
b. Install “demand based” controls on existing desiccant dryers.
Implementation
Facility management decided to start with the low-cost measures first and get a control and monitoring system in place. This was the motivation for this compressed air audit all along. Also, the control and monitoring system is intended for documenting and verifying potential future compressed air improvements project.
The customer eventually selected improvement recommendations 1, 3 and 4 b.
The control system has been installed in Mezzanine 1, on the other compressor in Mezzanine 2, and on Mezzanine 3 to communicate to the master control via the existing Ethernet which eliminated expensive installation of communication wires and resulted in a quick, easy and very cost-effective installation.
The following verification data and charts have been compiled after the installation of the Master control, the retrofitting of additional dryer, and the installation of the zero air less drains.
System Performance Verification
The two charts, in Image 4, show pre and post audit pressure profiles. The low pressure was recorded at min of 86 PSI compared to 85PSI. The max pressure was max 103 compared to 111 PSI and the average pressure has been reduced from 99 PSI to 95PSI.
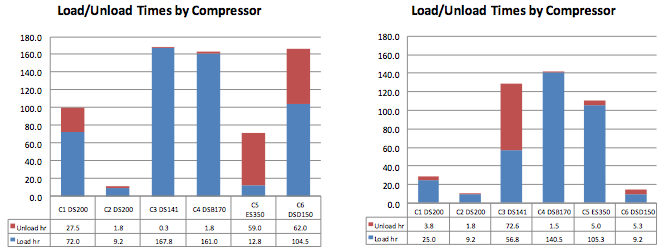
The pre and post installation graphs, in Image 5, show a significant difference in compressor utilization based on size. In the pre installation audit the largest compressor cycled the most. In the post audit only the smallest compressor cycled heavily and the larger compressors have a moderate to small unload share.
Overall compressor run hours accumulated to 679 hours during the audit and 436 hours during verification. That represents a reduction of 243 hours - a 35.8% reduction.
The unload share as % of energy cost has been reduced from 12.7% to 6.9%. Further reductions to 1-2% unload share are possible with the installation of the storage volume, as suggested, to 5 Gal/cfm.
The motor starts have slightly increased in particular for the small compressor. They are still in an acceptable range of less than 16 motor starts per day for the small compressor and 1-5 starts per day for the remaining compressors.
The energy cost was reduced by 21% which accumulates to \$ 61,244 per year. The simple ROI of the project was less than 10 months. Unload energy cost was reduced by 58%. Motor starts increased from 73 to 201 per week. This is an average of 4.8 motor starts per compressor per day. Load cycles have been reduced by 70% or from an annualized 285,000 to an annualized 84,500.
Image 4. Pre and Post-Audit System Pressure Profile
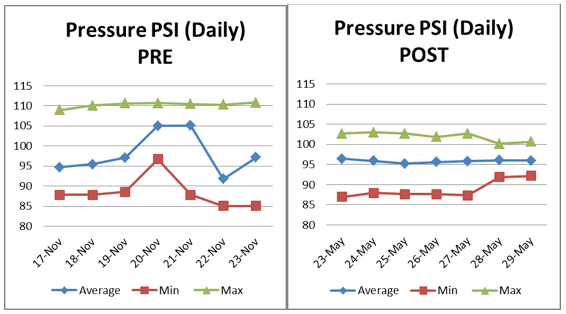
Image 5. Compressor Utilization
Continuous Improvement
At the time this article was written, discussions started again to improve the system by adding storage and by dealing with the oversized desiccant dryer at compressor #5.
Consumers Energy, the utility responsible for this facility, has a good compressed air incentive program. A wide variety of prescriptive measures for compressed air applications as well as custom projects are available. Custom project are being incentivized with 8 cents/kWh.
For more information about the Consumers Program visit their web site. http://www.consumersenergy.com/uploadedFiles/EE_Programs_2011/Business/Applications/business-incentive-catalog.pdf
The installed master control provides the baseline data required by utilities to document the system improvements for custom projects. Data is recorded on one second intervals and stored at 10 second averages. All data are available in excel for review by the utilities.
Conclusion
The audited baseline, the system simulation and the verification with the higher than our conservative predicted savings established confidence and trust in our work and led to additional audits at this client. Particularly, the transparency of the data and the audit was complemented. Compressed air systems are constantly changing and it is a continuous effort to keep and improve system performance. At this point in time, the client has installed additional dew points meters and system parameters and performance data are closely monitored on a continuous basis.
For more information please contact: Jan Michael Hoetzel, Dipl. Wirt-Ing. (FH), Owner and Principal of SIGA Development LLC, Airleader Distributor North America, email: info@airleader.us, tel: 616-828-0716, www.airleader.us.
To read more System Assessment articles, visit www.airbestpractices.com/system-assessments/compressor-controls.