International Wire Group, Inc. (IWG) headquartered in Camden, NY is the largest bare copper wire and copper wire products manufacturer in the United States with expanding operations in Europe. Products include a broad line of copper wire configurations and gauges with a variety of electrical and conductive characteristics , which are utilized by a wide variety of customers primarily in the industrial and energy, electronics, data communications, aerospace and defense, medical electronics and devices, automotive, and consumer and appliance industries.
IWG culture is one of continuous improvement, and customer satisfaction on the basis of quality, reliability, price, reputation, customer service, and on-time delivery. Advanced quality assurance and testing equipment plus continuous improvement upgrades and investments to manufacturing equipment ensures products will consistently meet customers' specifications and quality requirements.
The IWG Plant Engineering team members recognized that the compressed air system was a major energy user in the plant and its performance directly impacted the manufacturing process and product quality. Team members, Dave Sherwood, Tom Lewis, Eric Bryant, and John Hoyt represent a cross section of plant management, production, engineering, and R&D. The key to success was the interactive spirit of cooperation to prepare for the assessment, experiment with process modifications, and respond to challenges with the expertise and determination to troubleshoot and overcome obstacles necessary resulting in the successful outcome for the project.
The plant operates six high speed production lines that draw copper wire and plate the wire to exacting customer specifications. The continuous high speed plating lines pass wire through various liquid chemical process tanks that clean, etch, and plate the wire. Between tanks the liquid that has adhered to the wire must be removed before the wire enters the next chemical process. Compressed air powered “Air Wipes” blow the residual liquid from the wire as it passes through the center of the air wipe. Given that air compressors are large consumers of electricity, and the air wipes are large consumers of compressed air; attempts have been made to reduce the number of air wipes in use.
Through experimentation, it was found that quality control issues arose when several air wipes in the process were taken out of service. Without proper removal of process liquids, downstream chemical tanks become contaminated. Beyond the \$30K to \$40K cost of replacing spoiled chemicals, plating quality can be compromised; an unacceptable risk to IWG’s strict quality standards.
IWG plants in the area are served by National Grid, a major utility in the North Eastern USA. National Grid helped organize Compressed Air Challenge (CAC) “Fundamentals of Compressed Air Systems” 1 day training which was attended by IWG team members. Funding for the training was sponsored by NYSERDA (New York State Energy Research & Development Authority) and DOE (Dept. of Energy)..
At Compressed Air Challenge (CAC) Training the IWG Team learned about the CAC systems approach; matching compressed air supply to actual production requirements for pressure and flow. Upon return to the plant, team members explained to IWG Management that rather than focus only on the air wipes the solution was to look at the entire compressed air system and understand the actual production requirements of pressure and airflow. National Grid provided co-funding with IWG to perform a comprehensive compressed air system assessment. Tom Taranto of Data Power Services; a CAC Instructor and US DOE (Dept. of Energy) Sr. Instructor for AIRMaster+ Qualified Specialists, was contracted to conduct a compressed air system assessment at IWG Plant 3. National Grid was represented by Ram K. Kondapi, Sr. Technical Support Engineer and Mr. Tom Higgins, Account Manager.
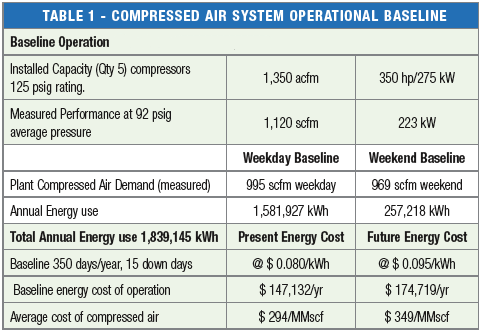
The IWG Plant 3 compressed air system supplies all plant air requirements including pneumatic cylinders, tools and other ancillary pneumatic equipment. Air wipes are the largest compressed air demand consuming the majority of the plant air, and are a critical compressed air end use application which directly influences the wire plating process and product quality. Growth of the plant over the years and physical space considerations resulted in less than optimal arrangement of compressors, support equipment, piping and piping layout. Five air compressors; two stage lubricant free design, with their auxiliary equipment were installed at four different locations within the plant. Baseline measurement of system performance including measured Airflow, Power, and Pressure data were taken during July and August of 2010.
In the past, plant personnel have conducted trials with various blow off nozzle configurations and have optimized the performance of individual air wipes. Previous efforts to reduce air consumption by using fewer air wipes were unsuccessful. At CAC Fundamentals training the plant team learned about “Artificial Demand”; and how operating compressed air end use applications at greater than necessary air pressure increases air consumption without any benefit to the production end use performance. Therefore, one technical objective of the system assessment was to assess air wipe performance and compressed air consumption at various supply pressures. Perhaps rather than reducing the number of air wipes, savings could be attained by controlling the air wipe pressure so that each air wipe consumed less compressed air while still giving satisfactory performance.
During the compressed air system assessment one production line was selected for air wipe testing. A 3” diameter Low Pressure (LP) compressed air header was installed in parallel with the existing 1” plant air pressure header (see Figure 1). A high flow precision pilot operated pressure regulator was installed to allow adjustment of air pressure to the LP air wipe supply header. Tests were performed to measure the air pressure –vs– airflow relationship while carefully monitoring the process chemical tanks and product quality. The data in Figure2 is a scatter plot of air wipe supply pressure versus measured compressed air consumption. Operating data was measured for pressure ranging from 40 to 60 psig and non operating data was taken at 15 to 20 psig with interpolated air consumption calculated between 20 and 40 psig.
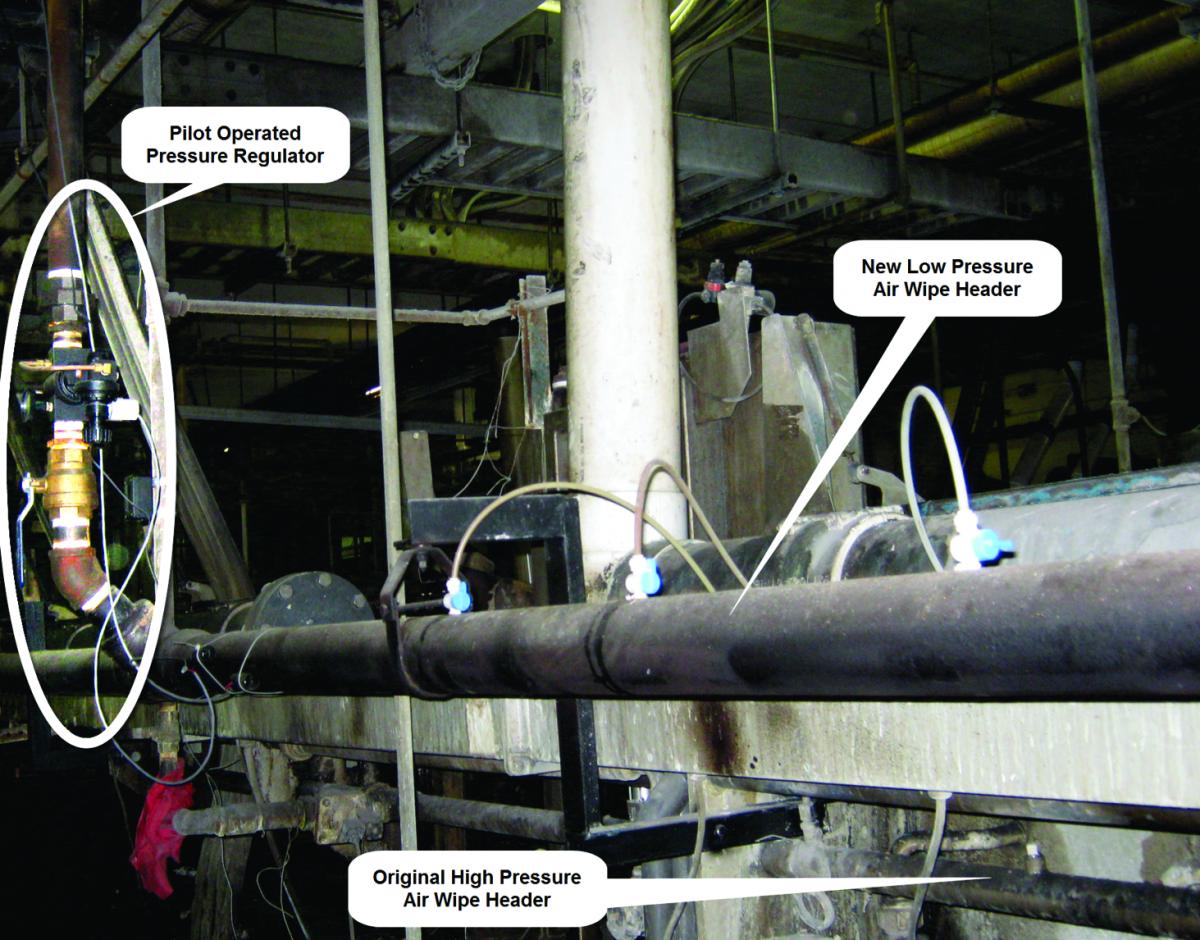
Figure 1–Air Wipe Test, Pilot Operated Regulator and New LP Air Wipe Header
Testing concluded that operating air wipes at 40 psig resulted in 45 scfm compressed air demand reduction. For six plating lines the projected air demand reduction was 270 scfm. Analysis was performed with the US DOE AIRMaster+ compressed air system software tool and energy savings of 624,306 kWh/yr and \$59,309 per year cost savings were projected.
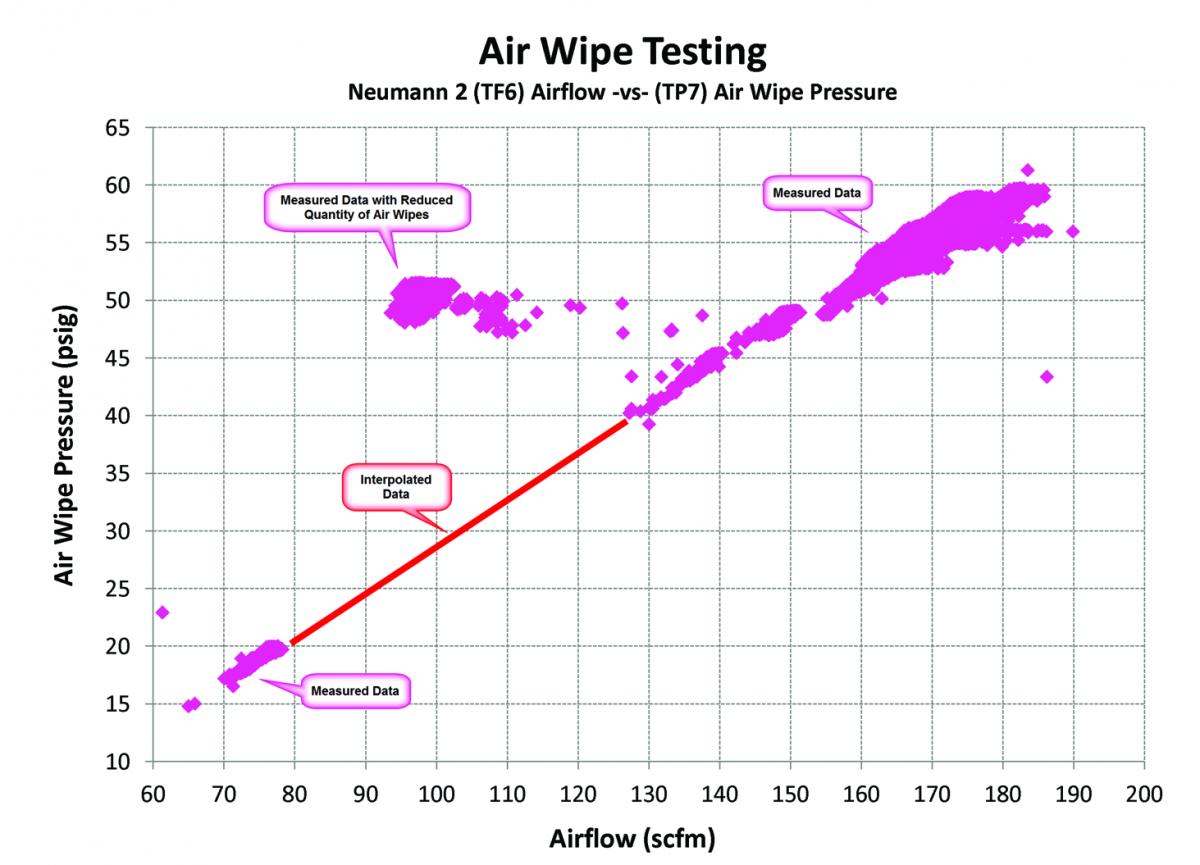
Figure 2 - Air Wipe Test Results, Air Consumption -vs- Pressure
Other key findings of the IWG Plant 3 compressed air system assessment were:
- Compressed air distribution piping is undersized with 2½” main line headers.
- Control pressure signals at the compressors were inconsistent due to multiple compressor locations and piping restrictions between compressors.
- Failed air dryers needed to be replaced.
- There is an area available to centralize the compressor installation providing an opportunity for heat recovery to make up air for space heating.
- Target pressure for air wipes is 40 psig, a select few air wipes may need to remain at higher pressure.
- Operating a portion of the compressor capacity as dedicated LP generation provides additional savings potential of 88,894 kWh/year with annual savings of \$ 8,445.
- Air wipes that can operate with Low Pressure air supply total over 70% of the present plant air demand.
Assessment Recommendations:
Recommendations included a two step implementation process with Phase 1 providing system redesign to operate as a split High and Low pressure generation, transmission, and end use sectors; and replacement air dryers. The proposed system block diagram is shown in Figure 3 below.
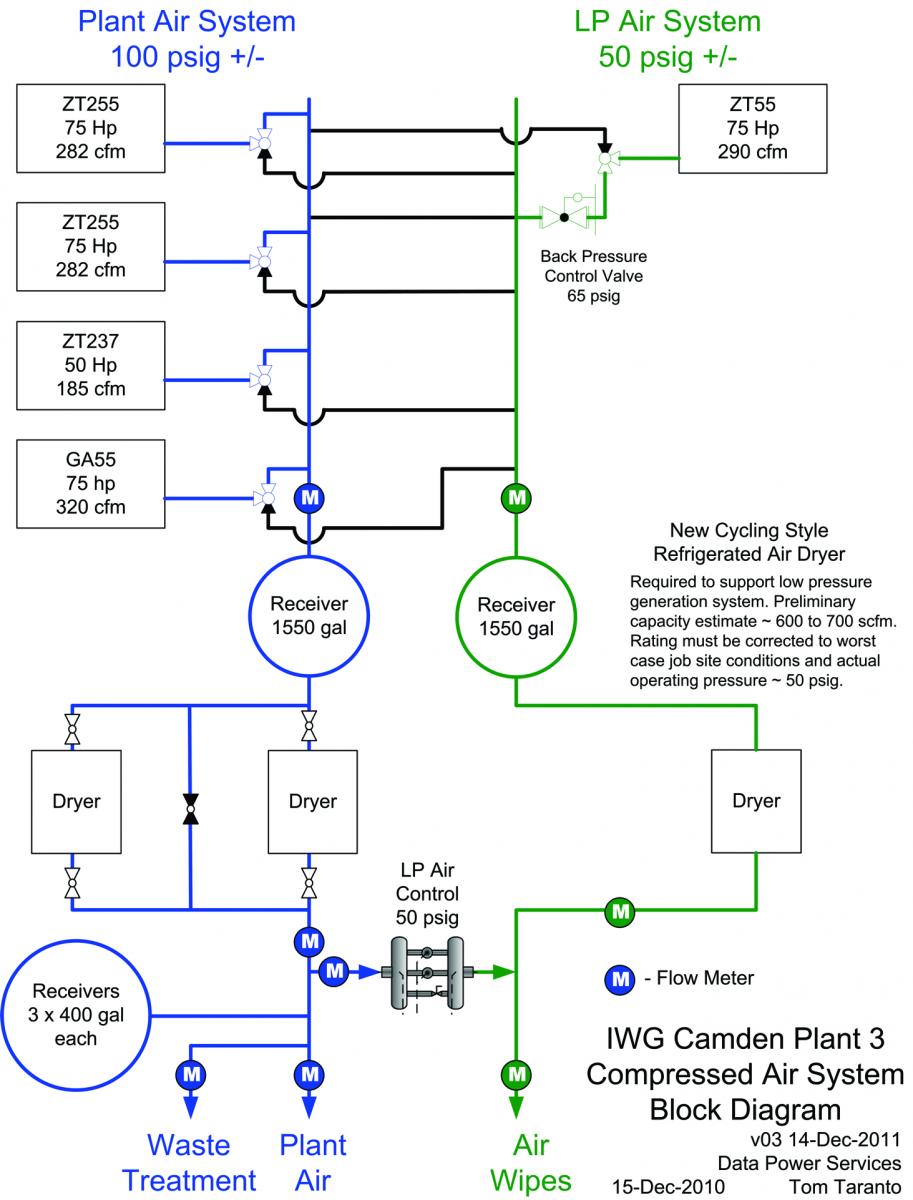
Figure 3–Block Diagram of Phase 1 Recommended System Design
Phase 1 Implementation:
Use existing air compressors relocated to a single area of the plant with improved ventilation and heat recovery.
- Improve compressor control with properly designed supply side piping and primary storage to allow existing auto-dual control to automatically start and stop excess compressor capacity.
- Allow two stage lubricant free compressors to be selected to supply either High or Low Pressure generation.
- Install a flow / pressure control operating as “spill valve” used to base load LP generation and control pressure of the LP demand sector.
- Upgrade treatment equipment to support both High and Low Pressure generation sectors.
- Distribution system upgrade including installation of a 6” diameter LP main line header.
- Total projected energy savings are 471,500 kWh/year ($ 44,800 / year).
Note that since the final LP target pressure (between 40 and 60 psig) had not been determined 60% of the maximum calculated savings were apportioned to Phase 1.
Measurement and Verification (M&V) of Phase 1 Implementation documented savings at 93% of projections. The M&V measurement plan targeted a 2 week baseline measured during the reporting period from 02 – 15 August 2011. Measured energy savings of 442,300 kWh / year yielding cost savings of \$ 42,000 / yr.
Heat Recovery:
In addition to the electrical energy savings as a result of implementation of above measures, the plant engineering staff also designed and implemented heat recovery of waste heat from the compressors to preheat make up air for the plant. Each compressor was connected to an insulated duct and plenum wall chamber equipped with motorized dampers that allowed warm air to be delivered to the plant during winter months and vented to outdoors during the summer months. The total heat recovery from the compressors was estimated to be approximately 544,290 BTU/HR during the winter months resulting in substantial savings in space heating.
Phase 2 of this project will include replacement of aging compressors with compressor performance optimized to the new air demand profile and High / Low Pressure generation system.
Phase 2 Implementation:
- Using M&V data evaluate the new air demand profile to optimize compressor performance selections.
- Installation of one or more new air compressors as LP base load capacity.
- Consider a new HP (High Pressure) compressor optimized for trim capacity.
Phase 2 Assessment Findings indicated that air wipes were operating at the high end of the 40 – 60 psig target range, operating at 58.8 psig. Investigation revealed that while the majority of air wipes can be operated in the lower end of the target pressure range, a few air wipes at key locations required the higher 58.8psig pressure. Those few air wipes can be reconfigured to operate from the HP Plant Air header and the LP System target pressure can be further reduced.
Other key findings of the IWG Plant 3 Phase 2 Assessment include the new compressed air demand profile. The Compressed Air Profile Histogram in Figure4 shows airflow data measured at a 6 second data interval averaged to 1 minute readings and plotted in a histogram using 20 cfm buckets from 400 to 800 scfm. Data shows total air demand is normally 600 – 720 scfm with 500 – 640 scfm LP demand indicating HP demand is between 80 and 100 scfm. Data validation compares measured Demand Total to Supply Total (AM+)data calculated using AIRMaster+ software. AIRMaster+ indicates slightly greater air flow which is expected since AIRMaster+ is calculating acfm and measured data is scfm. Performance was measured in August when elevated ambient temperatures would reduce measured scfm readings.
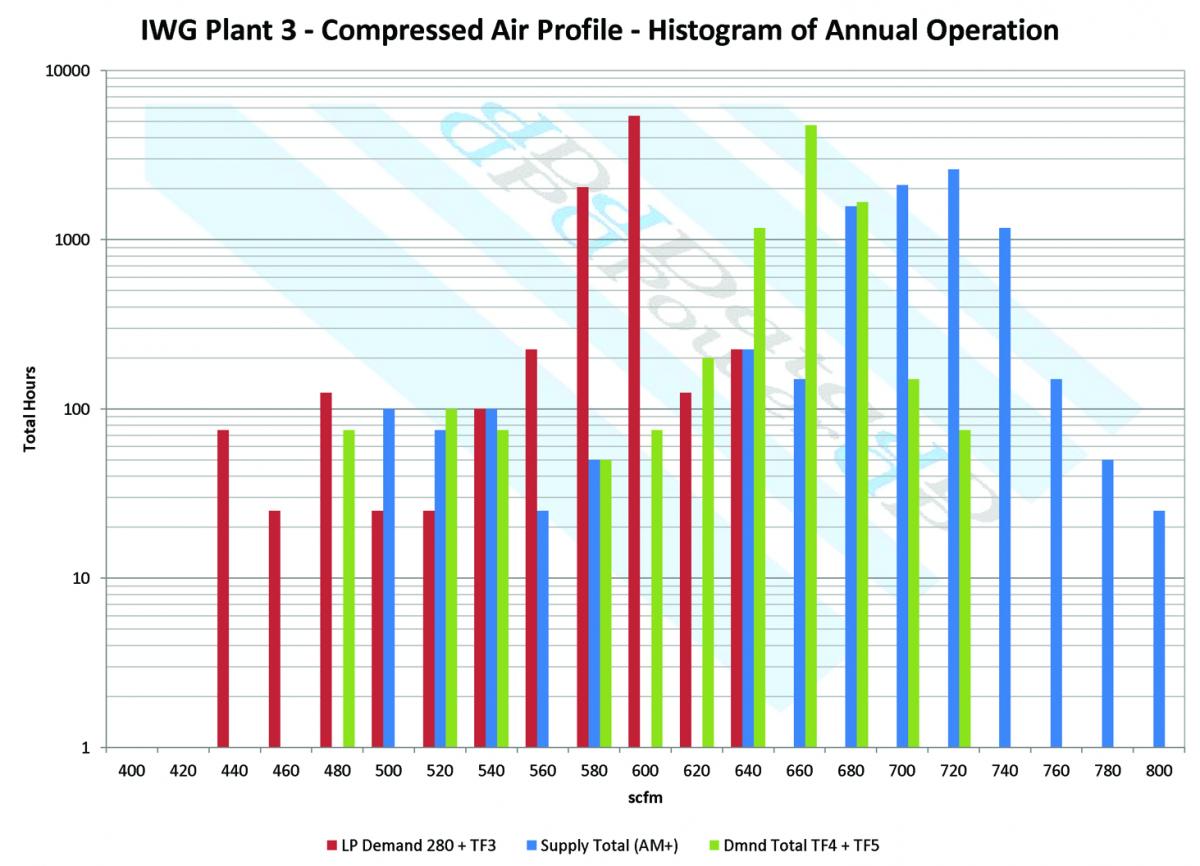
Figure 4–IWG Plant 3 Phase 2 Compressed Air Demand Histogram
Flow profile data in Figure4 was measured before the system was modified to move key air wipes to the HP Plant Air and the LP Air Wipe pressure was reduced from 58.8 psig to 50 psig. After making those changes, spot checks of measured airflow provided the data as shown in the diagram in Figure 5 below. As expected LP air demand is reduced at 50 psig operating pressure and HP air demand is slightly increased with addition of key air wipes being supplied from the HP Plant Air System.
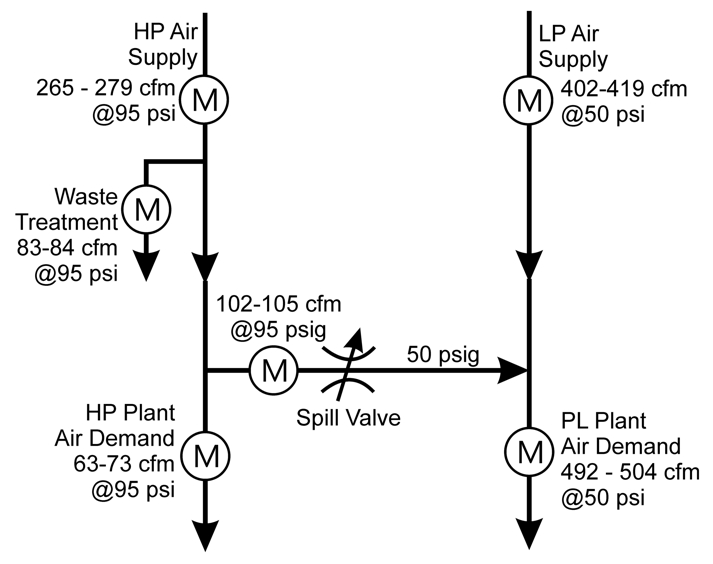
Figure5–IWG Plant 3 Phase 2 Flow Profile Spot Check Data
Phase 2 Assessment Recommendations:
Based on the demand profile in Figure 5; Phase 2 of implementation includes measures to further reduce air demand and improve the system’s supply / demand balance. The following action plan addresses recommended remedial measures.
- Install new air compressors to provide flexibility to meet the system’s range of new lower demand profiles and replace the existing aging less efficient air compressors.
- Install one 40 Hp two stage lubricant free rotary screw compressor to operate at 178 cfm and 50 psig.
- Install one 50 Hp two stage lubricant free rotary screw compressor to operate at 226 cfm and 50 psig.
- Install one 100 Hp Variable Speed Drive two stage lubricant free rotary screw compressor with a capacity of 80 - 331 cfm at 100 psig working pressure.
- Install pilot operated regulators (Qty 2), one each on the existing HP Plant Air Supply pipeline and the pipeline that serves Waste Treatment. Each regulator should be set to the lowest optimum supply pressure required by each of the demand sectors that they supply. Target pressure of about 85 psig is anticipated.
Normal plant operation with the recommended mix of air compressors will allow full load operation of the two LP System (50 psig) air compressors totaling 404 cfm of delivered airflow. As a result the HP System will require between 165 cfm and 225 cfm of air supply; 80 -100 cfm HP to LP spill flow, 45 cfm HP Plant Air @ 85 psig, and 40 to 80 cfm of air demand in Waste Treatment. The recommended VSD air compressor with capacity of 333 cfm will operate between 50% and 68% of full load capacity.
The initial control strategy is for operators to manually start and stop Low Pressure compressors operating as base load capacity, and the new High Pressure VSD compressor to operate as trim capacity. The overall air demand is relatively constant and changes incrementally as one or more of the six production lines are started and stopped. Since there are normally few changes in the plant operating scenario, and reduced operating scenarios represent a small fraction of operating hours manual operation is possible. It is recommended that consideration for compressor control automation be evaluated in the future.
Phase 2 Energy Reduction and Cost Savings Projections:
Installation of new air compressors optimizing the supply / demand balance is projected to result in 238,900 kWh energy reduction with an additional \$22,700 annual savings. The plant is presently purchasing and installing the equipment to complete Phase 2 implementation.
Summary:
Compressed Air Challenge Training provides fundamental understanding of the system approach to design and manage industrial compressed air systems. Efforts to improve the system addressing only a single component (the air wipes) of the system was unsuccessful in reducing energy use and improving system reliability. However, when applying the CAC System Approach, understanding production’s compressed air requirements and designing and optimizing the system to support those requirements results in energy savings, cost reduction, and improved system reliability.
To quote IWG Plant 3 Manager Eric Bryant; “After some initial issues requiring minor repair of the compressors, the system has performed for several months at 100% reliability.” The Phase 2 replacement of aging compressors is just beginning installation and commissioning.
Author Profiles:
Tom Taranto is a L2 CAC Certified Instructor. He is an independent compressed air system professional with more than 30 years of experience providing services to industrial clients, utilities, and energy agencies. He is the owner of Data Power Services, LLC. He has extensive experience in design and application of fluid power systems both hydraulic and pneumatic. Tom’s work involves compressed air system design, air compressor application, and performance of related compressed air system components. He conducts compressed air system assessments, equipment testing, and compressed air system training throughout the world. More information about Tom can be found at the CAC website. Contact Tom Taranto.
Ram K. Kondapi is a Senior Engineer with extensive industrial experience and employed with the Commercial and Industrial Energy Efficiency group at National Grid’s offices in Syracuse, NY. In this position, he assists National Grid’s field personnel and commercial/industrial clients in the upstate NY and New England regions with evaluation and implementation of energy efficiency projects. Ram is an Association of Facilities Engineers (AFE) Certified Plant Engineer (CPE). He has a Bachelors of Mechanical Engineering degree from Andhra University in India and a Master of Industrial Engineering & Operations Research from Illinois Institute of Technology, Chicago, IL. National Grid is a CAC Sponsor. Contact Ram Kondapi.
To read more Pressure System Assessment articles, please click here.