A growing dairy product processing plant operates 24 hours per day, 7 days per week, 365 days per year in the upper Midwest of the U.S. The primary products manufactured and packaged are milk, butter and powdered milk products. Product demand is strong and projected to grow.
Our firm was asked to conduct a supply-side compressed air system assessment due to uptime issues related to the compressed air system. There were two situations brought to our attention. The first was that production at times was having to slow down, or even stop, due to compressed air system pressure falling below the required levels. The second reason was due to reports, from plant personnel, of compressed air moisture problems negatively affecting the bag life of the dryer baghouses.
Characteristics of the Existing Compressed Air System
At the time of our system assessment, their average energy cost at the plant was $0.087 per kWh. The firm spends $186,000 per year on energy to pressurize their compressed air system. The compressed air system operates 8,760 hours per year. The air demand profile of the compressed air system ranges from 855 scfm to 1,234 scfm from average to peak flow periods. This is relatively stable when compared to other air systems in a similar industry. The system pressure varies 3-4 psig in the header during production. This is normal considering the capacity controls of the compressed air system.
Table 1. Existing Compressed Air System Characteristics
|
Measure |
Annual Operation |
|
| Average system flow |
876 |
scfm |
| Sustained peak flow |
1,255 |
scfm |
| Average compressor discharge pressure |
89 |
psig |
| Average system pressure |
86 |
psig |
| Input electric power |
243.7 |
kW |
| Operating hours of air system |
8,760 |
hours |
| Annual electric use |
2,135,174 |
kWh/year |
| Average specific power |
3.59 |
scfm/kW |
| Electric cost for air /unit of flow |
$212.10 |
$/scfm/year |
| Electric cost for air /incremental psig |
$1,038.63 |
$/psig/year |
| Annual electric cost of compressed air |
$185,760 |
$/year |
There are two separate air compressor areas located next to each other but separated by a wall. All air compressors tie into the same collection 2 ½” piping header and the air in this header can travel in either direction depending on the system demand.
Figure 1. Existing Compressed Air System Schematic
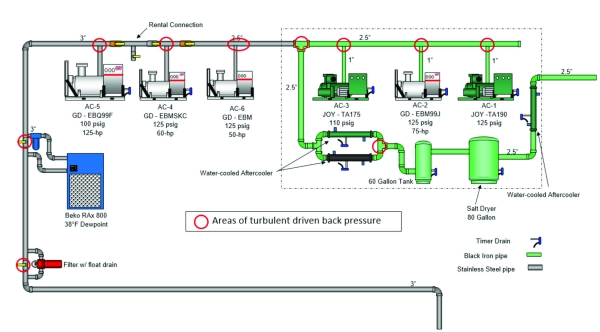
Click to enlarge.
The Existing Air Compressors
The compressed air supply consists of six well-maintained, single-stage, lubricated, water-cooled, rotary screw air compressors. Air compressors #1 and #3 are very old, but like the others, have been well maintained. Air compressor #6 was added in recent years to help keep up with compressed air demand and to provide some backup. Plant personnel states, however, that if either air compressor #4 or air compressor #5 is down for repairs or maintenance, the system cannot maintain adequate pressure and production must slow down or stop. All the air compressors use modulation controls with no blowdown. There is no central control system for all the air compressors.
- #1 Model TA190 110 psig rated 40hp unit
- #2 Model EBM99J 125 psig rated 75hp unit
- #3 Model TA175 115 psig rated 40hp unit
- #4 Model EBMSKC 125 psig rated 60hp unit
- #5 Model EMQ9995 100 psig rated 125hp unit
- #6 Model EBH 125 psig rated 50hp unit
Table 2. Annual Load Profiles of Existing Air Compressors
|
Unit # |
Air Compressor Model |
Full load |
Electric demand |
Baseline air flow |
|||
|
Demand (kW) |
Air flow (scfm) |
% of Full kW |
Actual kW |
% of Full flow |
Estimated flow |
||
|
1 |
TA190 |
37.4 |
173 |
49% |
18.2 |
42% |
73 |
|
2 |
EBM99J |
58.7 |
291 |
92% |
54.0 |
79% |
229 |
|
3 |
TA175 |
36.3 |
155 |
19% |
6.9 |
12% |
19 |
|
4 |
EBMSKC |
47.4 |
215 |
79% |
37.5 |
50% |
108 |
|
5 |
EMQ995 |
108.3 |
566 |
85% |
92.4 |
59% |
332 |
|
6 |
EBH |
40.7 |
193 |
85% |
34.8 |
59% |
115 |
|
|
Total |
|
|
|
243.7 kW |
|
876 cfm |
Table 3. Annual Air Compressor Operation/Use Profile
|
Air Compressor |
Operating hours |
% of power |
% of flow |
| #1 TA190 |
4,510 |
94% |
81% |
| #2 EBM99J |
8,563 |
94% |
81% |
| #3 TA175 |
1,903 |
87% |
57% |
| #4 EBMSKC |
8,009 |
86% |
55% |
| #5 EMQ995 |
8,484 |
88% |
61% |
| #6 EBH |
8,471 |
88% |
61% |
The Existing Compressed Air Dryers
The only compressed air dryer in the system is a RAx 800 water-cooled, non-cycling, refrigerated dryer (see Figure 1). It is sized for 800 scfm, at design specifications, and is providing a reliable 38 °F (3 °C) pressure dew point. This dried compressed air supplies most of the facility.
There is a separate compressed air line, which supplies the Dryer baghouses, which is cooled by chilled water heat exchangers with no reheater (labeled as water-cooled aftercooler in Figure 1). This air is still saturated at the discharge temperature of the heat exchangers. If the ambient temperature falls below this temperature, liquid water will form in the compressed air lines.
Water (condensate) and oil carryover problems in the current compressed air system are not an issue on the refrigerated dryer side of the system. They can be significant on the chilled water-cooling side, using the aftercooler, during hot summer months. Plant personal stated they are having, at time, water problems in the #1 and #2 Dryer baghouse. The problems increase in magnitude during more humid months.
The correct way to eliminate water and oil in the compressed air system is to clean and dry the air immediately after it is produced in the air compressor room. Then clean dry air can be stored in a separate air receiver and can flow to the system, as required. Some guidelines include:
- Generally, it is best to eliminate water and oil at the compressed air source before they enter the air system.
- Water vapor, when condensed to liquid in the drying process, must be removed immediately or it can re-contaminate compressed air by evaporation and overflow.
- Every 20 °F increase in temperature will almost double the moisture load that air will hold. Refrigerated compressed air dryers are usually capacity rated at 100°F (38 °C) and 100 psig (7 bar) inlet air conditions. At 120°F (49 °C) and 100 psig, the dryer’s capacity rating is reduced by 50%.
- Putting dry/oil-free air into the system 90% of the time and then allowing wet/oily air to enter sporadically 10% of the time will make the system wet or oily all the time. The water and/or oil will fall out within the piping system and continue to re-entrain and contaminate and/or collect in the low spots of the system. This will cause recontamination as liquid is pulled into the flowing compressed air system. Bypassing the dryer with part of the air (controlled by the bypass valve) will almost always end up with wet air. A wet/oily system could take many months of continued flow of clean dry air to “clean up.”
Existing Compressed Air Condensate Drains
There are a total of seven (7) compressed air condensate drains. They are timed electric drains actuating solenoid valves to open and close. It’s estimated they are using 21 scfm of compressed air. They should be replaced with electric or pneumatic-operated zero-loss condensate drains which will not consume compressed air.
Table 4. Existing Compressed Air Condensate Drains
|
Location |
Type |
Qty |
Size |
Use (%) |
Total Flow |
Project123 |
| Heat Exchangers Old Room |
Timer |
3 |
27 |
30 |
9 |
Install new zero-loss, level-activated type condensate drains. |
| #1 Compressor Moisture Separator |
Timer |
1 |
9 |
30 |
3 |
|
| #2 Compressor Moisture Separator |
Timer |
1 |
9 |
30 |
3 |
|
| Old Room Tall Tank |
Timer |
1 |
9 |
30 |
3 |
|
| Old Room Short Tank |
Timer |
1 |
9 |
30 |
3 |
|
|
Totals |
7 |
|
21 |
|||
Compressed Air System Assessment Recommendations
The proposed system has many changes. The focus of the changes is to eliminate downtime relating to the compressed air system. While the project will provide energy savings of $56,000 per year, the benefits are focused on increasing production uptime.
In order to stabilize compressed air system pressure and allow for future growth, the recommendation is to install two new 125 hp rotary screw air compressors. These are to be placed where the #4 and #6 air compressors are now. These units are to be moved to replace the aging #1 and #3 air compressors in their current locations (see Figure 2).
Along with the new air compressors, a central air compressor control system, able to turn on and off compressors depending on demand, should be installed and all compressors tied into it. This will keep the system running at the most efficient level and still maintain adequate supply. This system should be more than just a sequencer switching compressors based on time. It should be able to keep all necessary compressors at full load with only one trimming. This should be the smallest horsepower unit to effectively perform the job with all others off.
The interconnecting piping needs to be replaced with a properly sized collection header. A new 1500 gallon storage tank should be installed.
A new refrigerated dryer and a mist eliminator should replace the water-cooled aftercoolers for the air leaving the old compressor room. This new dryer and filter will provide clean dried air to the Dryer Baghouses and eliminate the issues there. Lastly, zero-loss, level-activated condensate drains should replace the existing timer drains.
Table 5. Annual Load Profiles of Proposed Air Compressors
|
Unit # |
New Configuration of Air Compressors |
Full load |
Electric demand |
Proposed air flow |
|||||||
|
Demand (kW) |
Air flow (scfm) |
% of Full kW |
Estimated kW |
% of Full flow |
Estimated flow |
||||||
|
1 |
EBM99J |
57.0 |
291 |
0% |
0.0 |
0% |
0 |
||||
|
2 |
EBMSKC |
46.1 |
215 |
0% |
0.0 |
0% |
0 |
||||
|
3 |
EMQ995 |
105.2 |
566 |
0% |
0.0 |
0% |
0 |
||||
|
4 |
EBH |
39.6 |
193 |
0% |
0.0 |
0% |
0 |
||||
|
5 |
New R90i constant speed |
104.0 |
558 |
99% |
103.3 |
98% |
546 |
||||
|
6 |
New R90N variable speed |
114.1 |
597 |
56% |
63.5 |
52% |
309 |
||||
|
Total |
166.9 kW |
|
855 cfm |
||||||||
Table 6. Proposed Annual Air Compressor Operation/Use Profile
|
Compressor |
Operating hours |
% of power |
% of flow |
| EBM99J |
23 |
41% |
2% |
| EBMSKC |
0 |
0% |
0% |
| EMQ995 |
0 |
0% |
0% |
| EBH |
0 |
0% |
0% |
| New R90i constant speed |
8,759 |
99% |
98% |
| New R90N variable speed |
8,330 |
58% |
54% |
Figure 2. Proposed Compressed Air System Schematic
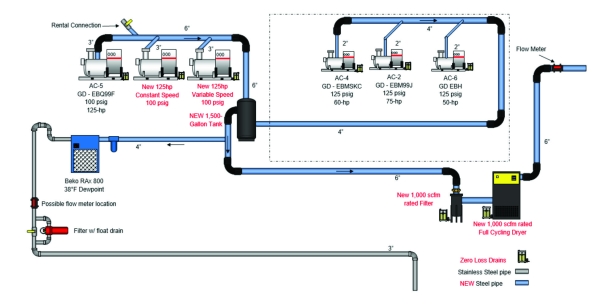
Click to enlarge.
For more information on APenergy visit apenergy.com or call 740.862.4112.
To read similar Compressed Air System Assessment articles, visit https://www.airbestpractices.com/system-assessments.
For expert presentations, visit our Webinar Archive Section dedicated to Air Compressor Technology at https://www.airbestpractices.com/magazine/webinars.