A. Introduction
This West Coast pharmaceutical facility has a very clean and organized compressed air system. All equipments is in good working order in the compressor room. The compressor room itself is very clean and well ventilated. The management requested a compressed air system audit for two reasons:
- Production problems and downtime resulting from the presence of moisture in the compressed air lines. The compressor room dryers were functioning properly so how could this happen?
- Awareness of the high cost of compressed air and a desire to find ways to reduce compressed air demand.
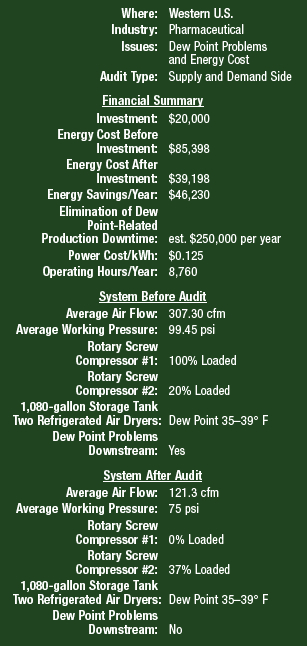
This article will describe the actions taken to address these two issues. The facility operates “24/7” so we have 8,760 operational hours per year. The average electrical rate at this facility is \$0.12 kW/h. The power cost formula used is based upon the facility’s current operating conditions of 3.89 CFM/BHP and 95% average motor efficiency.
Power Cost = (BHP *0.746 * 8,760 hours x \$0.12 per kW/h) / Avg. Motor Efficiency (95%)
The focus of this audit is on the “Demand Side” with the very top priority being to identify the root cause of the presence of moisture in the compressed air lines.
B. Compressor Room Review
The Compressor Room is extremely clean and well ventilated. There are two rotary screw compressors which are oil lubricated and air-cooled. The air is dried by two parallel refrigerated air dryers. The air then goes into a common header and flows into a 1,040 gallon air storage tank. The air then flows into a Intermediate Flow Controller. From here the compressed air leaves the compressor room and enters the facility. The average CFM per BHP between the two air compressors is 3.80 CFM per BHP.
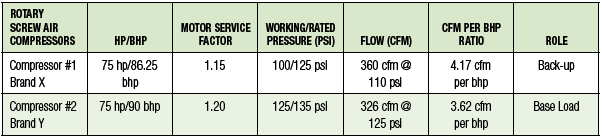
Upon entering the compressor room we noted an audible air leak in Compressor #2. We found the leak to be coming from the air end and recommended that the air compressor service provider be contacted immediately. Both air compressors are operating via modulation control. Compressor #2 acts as the base load machine while Compressor #1 is the back-up machine when pressure falls to a predetermined set point.
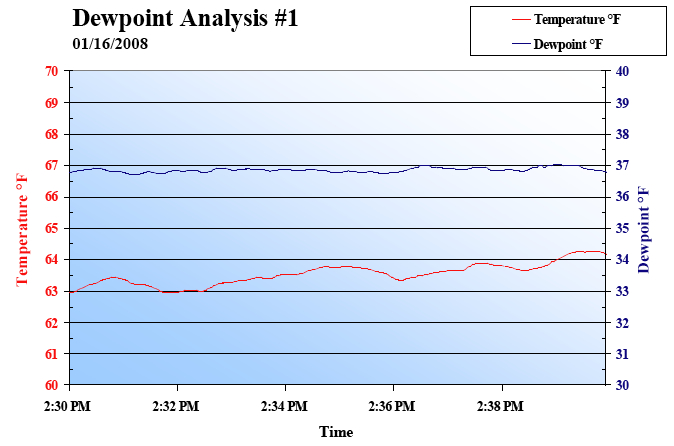
The two refrigerated air dryers are in good working condition and functioning properly. They are designed to produce a dewpoint range between 33 F and 39 F at a maximum flow of 330 CFM at 100 psi. We took dewpoint measurements at the compressor room outlet (for one week) and found that the average dewpoint achieved was 36 F. This correct dryer performance is what has the facility bewildered by the presence of water in the compressed air lines in the factory. It is worth noting that the dryers are not capable of drying the full air output capacity of the air compressors if factory demand should increase. The dryers have integrated 1 micron particulate filters. We recommend that the facility install a 0.01 ppm oil coalescing filter to protect against oil contamination downstream.
The 1040 gallon air storage tank is adequate for the air demand in the facility. During production we recorded an average air flow of 307.30 CFM which means the tank is providing 3.38 gallons of storage per 1 CFM of air storage. The tank is also piped properly (after the air dryer) with air entering the bottom of the tank and exiting the top – providing more surface area for moisture to be separated and fall to the bottom of the tank.
C. Solving the Problems with Moisture
It was initially reported that the plant was “having problems resulting from an excess of water in the compressed airlines”, with the primary area of concern being the small cylinders in the plant. As a standard part of our audit procedure we took dewpoint readings. These test showed a refrigerated drying system according to its specifications. The data depicted below shows a very steady dewpoint with less than half a degree fluctuation over a ten minute time span. The 36 °F average dewpoint is well within the expected range of performance for these dryers.
As a result of the ongoing condensation issues, the factory had taken some actions in hopes of remediating the problem. The solution the plant put into place was to install water separators on each line and open the drains on Filter-Regulator-Lubricators (FRL’s) throughout the plant. We found a total of 18 FRL units with the drains open, exhausting approximately 2 CFM each worth of compressed air, totaling 36 CFM worth of compressed air. The problem with this is that the only thing exhausting through the drains was compressed air, thereby decreasing plant pressure at the same time.
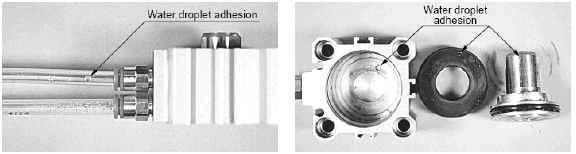
Moisture in Pneumatic Cylinders Created Production Down-Time
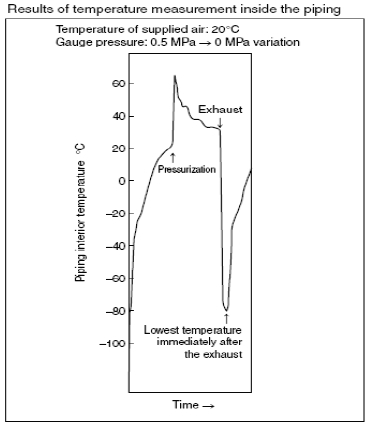
Adiabatic Expansion
Through further invest igation we found the root of the problem. When air is discharged from the piping between the cylinder and the valve, the temperature of the air drops due to adiabatic expansion. . If the atmospheric dewpoint of the supply air is T1, and the temperature of the air T2 after adiabatic expansion falls below this value (T1<T2), then mist formation occurs. Most of the mist is discharged through evaporation by the surrounding heat. However, a small amount of residual mist tends to adhere to the inner wall of the piping. The solenoid valve is switched again and new compressed air is supplied, so the residual mist in condition remains on the side of the cylinder. The second issue was the length of piping between the cylinder application and the valve. When the cylinder is small and the piping is long (that is, the volume of the piping is longer than that of the cylinder), air inside the cylinder cannot be exhausted at the time of the release and remains inside the piping. As the cylinder cycles, the mist accumulating near the cylinder increases, finally resulting in the formation of large water drops and condensation.
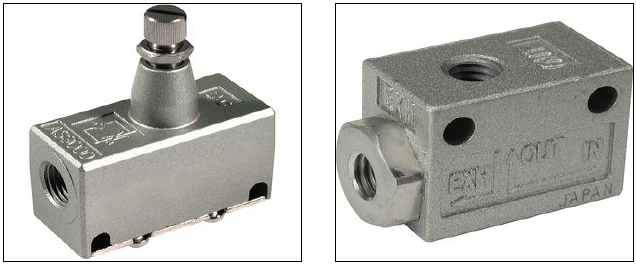
The Solution to Moisture Problems in Pneumatic Cylinders
There is a very effective solution to this problem, the installation of quick-exhaust valves directly onto the cylinders. These will allow for the cylinder to fully exhaust on every cycle, thereby eliminating condensation build up and save the cylinders. Along with saving the cylinders in the plant, there is no need to keep the drains of the FRL’s opened in the plant. Leaving the drains opened is actually creating a larger pressure drop throughout the plant, and wasting 36 CFM of compressed air.
Understanding what is happening with the pneumatic cylinders was the key to solving this problem. The facility had been considering installing desiccant air dryers. This would have been a significant capital expense and would not have solved the problem. We were able to identify the adiabatic expansion occurring between the cylinder and the valve. The solution deployed of quick-exhaust valve was a minor expense and achieved with little effort.
Quick Exhaust Valves Solved the Problems with Moisture
D. Demand Side Audit
Aside from solving the downstream moisture problem, our audit reviewed pneumatic circuitry in the facility and also included a compressed air leak audit. Below is a brief summary of some of the opportunities discovered and solved. The end result was that air demand was reduced by 186 CFM. This reduced the plant compressed air demand from an average of 307 CFM to an average of 121 CFM.
The Five Label-Aire Machines
We took note of five Label-Aire machines in the factory. These units were constantly being pressurized even when not being used. We conducted a point-of-use test on these machines and found that each machine consumed an average of 4.2 CFM even when not in use. We only sampled a fragment of time so we are not sure of what percentage of the time the machines are idled but plant personnel tell us that it is a significant percentage of time.
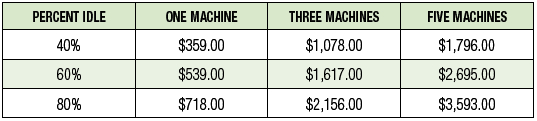
The solution here is to keep the Label-Aire machines from consuming air when idled. This is easily achieved by the installation of two-positioned solenoid valves. The solenoid of these valves will effectively actuate this application only when the product is present. The solenoid of these two-positioned valves can be actuated via several applications such as relay sensors and electronic signals. The table below shows the savings opportunity.
Label-Aire Machines Air Consumption Costs When Idle
The Ten Blow Guns
There are ten blow guns at the facility which use inefficient nozzles. This can be costly in the long run due to the decreased impact pressure and increased waste of compressed air. We recommend using high-efficiency nozzles, which can reduce air consumption by 50-75% while increasing the impact pressure at the work surface. These high-efficiency nozzles utilize the Venturi effect to gain efficiencies.
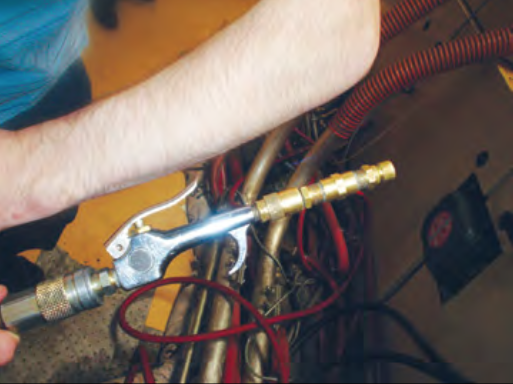
High Efficiency Nozzles on Blow Guns
The Cutter Machine Causes Plant Over-pressurization
The cutter machine is causing the entire plant to run at 100 psig because it requires 95 psig. We conducted a point-of-use test on this machine to verify its’ air usage. The machine was operating between 85 and 90 psig when we started the test. Actual pressure changed over time from 71 psig to 104 psig with 90 being the average. Air flow went from 20 cfm to 10.4 cfm with 4.3 cfm being the average. The cutter was actuating twice a minute, in one minute and 15 second cycles with an intermitten down period of approximately two and one-half minutes.
Due to the intermittent demand of this application, we are recommending the use of a pneumatic booster coupled with a air receiver. This will allow us to reduce the air pressure across the entire facility.
Air Leaks
|
|
Leak locations in % at the facility |
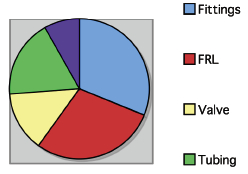
We have identified and tagged 28 compressed air leaks in the facility. They account for 120 CFM equating to 39% of the plants’ average air flow of 307 CFM. Leaks were found on the airend of one air compressor, and plant-wide on FRL’s, fittings, gauges, and pneumatic tubing.
It is important to have a leak remediation campaign in place to keep leaks from consuming unnecessary compressed air. A proactive approach to leak detection should include all individuals within the plant and the education of machine operators on the cost of leaks.
Machine operators could then combat leaks as they develop by immediately tagging them and notifying maintenance. This approach to leak remediation is perfect for leaks that can be easily felt and heard. Some leaks cannot, unfortunately, be detected by the human ear. We utilize ultrasonic leak detectors to find leaks that are out of range and hard to hear or feel.
E. Capture the Savings
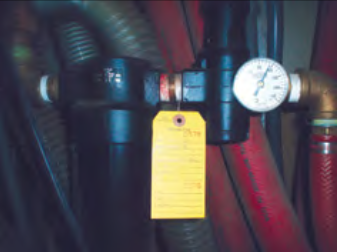 |
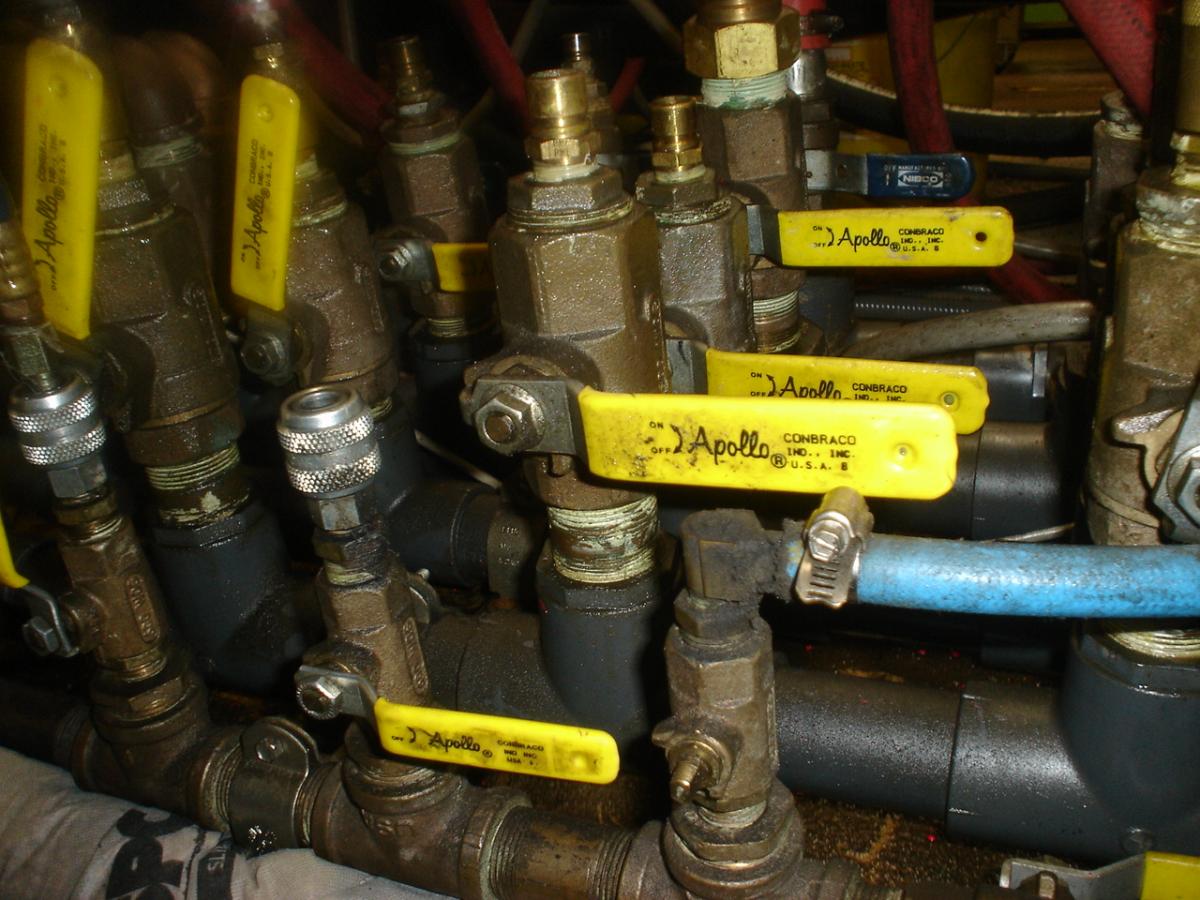
Air Leak on FRL |
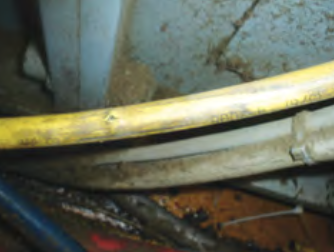 |
Multiple Holes/Leaks in Tubing |
|
|
|
|
The demand side audit made it possible for us to reduce average air demand from 307 CFM to 121 CFM. We fixed leaks (120 cfm), closed open drain valves (36 cfm), and will reduce over-all plant pressure (30 cfm). We now need to look at how the compressors are operating and if they controls are set to capitalize on the new compressed air demand profile.
The “Before” situation was this to produce 307.3 cfm:
- Compressor #1 ran 100% loaded in modulation mode. At 100% power it had 90 BHP which equated to \$74,292 in annual costs of operation.
- Compressor #2 ran 20% loaded in modulation mode. At 78% of power it consumed 67.3 BHP equating to \$11,106 in annual energy costs of operation.
- Total annual energy cost of operation was \$85,398
The “After” situation was this to produce 121.3 cfm:
- Compressor #1 was placed on standby for emergency situations. \$0 energy cost.
- Compressor #2 was capable of having its’ controls modified to Load/No-Load. We ran the machine 37% loaded to meet the demand. At 55% of Power it had 47.45 BHP equating to \$39,168 in annual energy costs of operation.
- Total new annual energy cost of operation was \$39,168
The new annual energy costs to run the air compressors represents a savings of \$46,230 per year.
Conclusion
Understanding pneumatics is core to conducting a strong demand side audit. Pneumatic circuits were where the audit was able to discover the dewpoint problem and the opportunities to reduce air consumption and pressure. Understanding air compressors and air compressor controls then allowed the installations’ energy costs to be reduced as a result of the demand side improvements.
For more information please visit www.smcusa.com.