Audit of the Month |
|||||||||||||||||||||||||
|
|||||||||||||||||||||||||
|
|||||||||||||||||||||||||
|
|||||||||||||||||||||||||
|
This factory currently spends \$735,757 annually on the electricity required to operate the compressed air system at its plant. The group of projects recommended in the system assessment will reduce these energy costs by an estimated \$364,211 (49% of current use). Estimated costs for completing the recommended projects total \$435,800. This figure represents a simple payback period of 14.4 months.
Current System Description
This is a relatively large operation with ten production lines. The compressed air system is supplied compressed air by several generations of mostly Joy (Cooper Cameron) compressors and two 1995-era Ingersoll Rand 300-hp class units. The Joy units include two 1975-era, 500-hp class machines, two 1985-era, 450-hp class machines, and one 2000-vintage 200-hp compressor. These compressors are well applied and apparently very well maintained and monitored on their central data acquisition system.
The air is water-cooled after-cooled and then goes to four blower purge dryers on the 2nd Floor. During our site visit, all the dryers were working well with their dewpoint demand control engaged and working. Pressure dewpoints were always at –40_F or lower.
The plant runs 24 hours a day, 7 days a week, almost all 365 days a year. There are two planned shutdown days every year. For calculating usage, we have agreed to use 8,760 hours per year. The new negotiated power cost from the plant’s utility provider is 6 cents per kWh.
Measurement Actions Taken
The following actions were taken to establish baseline measures for flow and pressure:
- Temperature readings were obtained on all units using an infrared surface pyrometer. These were observed and recorded to correlate to the unit’s performance, load conditions and integrity.
- Critical pressures including inlet and discharge were measured with calibrated digital calibrated vacuum and pressure test gauges with an extremely high degree of repeatability.
- The input kW and other pertinent electric operating data on all units was taken from the plant’s very effective operating data monitoring systems.
- The same basic measurement activity was carried out for system pressure using a similar, high-caliber Ashcroft test gauge.
- Air flows (scfm) were measured and logged with a thermal mass, heated, wire-type flow meter with data fed to the plant’s monitoring system. We were able to capture this data from the plant’s monitoring system.
Establishing the Cost of Compressed Air
During our site visit, the air compressor units performed very well, spending very little time in blow-off. However, there are seven air compressors and usually three units carry the plant – two are at idle and two are not running, waiting to come on in the auto hot start “ready” mode.
The air system operates 8,760 hours per year. The load profile (air demand of this system) is relatively stable during all shifts. Overall system flow ranges from 4,000 scfm during production to 5,000 scfm. The system pressure runs from 68 to 73 psig in the headers during production.
Actual electrical demand of the air compressors was measured at 1,318 kW while producing 5,068 scfm of compressed air. The blended electric rate is \$0.06/kWh and the facility operates 8760 hours per year. Annual plant electric costs for compressed air production, as operating today, are \$693,161 per year. This equals a “cost of compressed air per year”, of \$136.69 per scfm.
If the electric costs of \$43,106 per year associated with operating ancillary equipment such as dryers are included - the total electric costs for operating the air system are \$736,177 per year.
.png) |
||
The INAPPROPRIATE USES of 1,881 scfm
The System Assessment recommends both supply-side and demand-side modifications. Due to space limitations, we will only detail the demand-side action plans in this article. The summary of the supply-side recommendations is:
- Installing a new, more-efficient, base-load centrifugal air compressor to carry the load of the factory. The existing units will be shut-off and used as back-ups. The new air compressor will have a compressor-control system allowing the factory to benefit from the air useage-reduction projects outlined in the demand-side recommendations.
- Replace the current blower-purge desiccant dryers with a new heat-of-compression air dryer. Existing dryers will be shut-off and used as back-ups.
The Demand-Side Assessment identifies several ways to reduce the compressed air demand (scfm) in the factory. It is critical to note that the energy-savings documented will only be realized if the new air compressor with the load-adjusting compressor-control system is installed. The demand-side actions are:
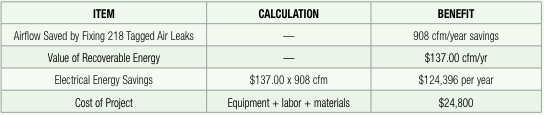
- Repair 218 tagged compressed air leaks for 908 cfm in savings
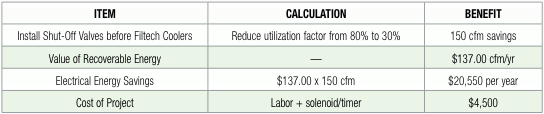
- Place automatic shut-off valves on laser cooler units for 150 cfm in savings
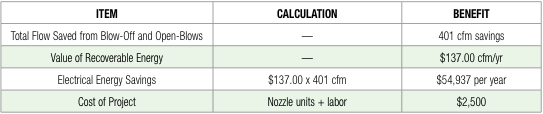
- Reduce blow-off and open-blows for 401 cfm in savings
- Make vacuum generator adjustments for 62 cfm in savings
- Eliminate Pneumatic air amplifiers for 360 cfm in savings
.png) |
||
| *Savings are dependent upon the installation of the new air compressor which has the capacity-control system required to translate reductions in air use into lowered electric costs. |
Repair Compressed Air Leaks
A partial survey of compressed air leaks was conducted at the plant and 218 leaks were identified, quantified, tagged, and logged. Potential savings totaled 980 cfm for the 218 leaks that were identified. Repairing these 218 leaks translates into an annual savings of \$150,037 per year (assuming the recommended compressor-control changes are implemented).
With a few minor exceptions, most of the leaks could not have been found without the use of an ultrasonic leak detector and a trained operator. We recommend an ultrasonic leak locator be used to identify and quantify the compressed air leaks. Leak locating during production time with the proper equipment is very effective and often shows leaks that are not there when idle. In a system such as this one, some 80 to 90% of the total leaks will be in the use of the machinery, not in the distribution system.
A regular program of inspecting the systems in “off hours” with “air powered up” is also a good idea. Some of the areas surveyed in the leak study included a great deal of high background ultrasound noise that shields many of the smaller leaks, particularly the blow-offs. As the blow-offs are repaired or modified (along with the Venturi vacuum generators), check the area closely for leaks that may have been missed. In continuing the leak management program, plant staff should perform leak detection during non-production hours in order to eliminate some of the high ultrasonic background noise.
 |
||
Automatic Equipment Shut-off Valves
Shutting off the air supply to machinery when not in use can often minimize some of the most significant air leaks. When such air users are found, there are usually some very economical and easy methods to switch off air automatically as machinery is shut off.
The project cost section of this audit lists some slow-acting electric-operated automatic ball valves that can be installed in the main feed line to a piece of equipment and wired so it will open and close whenever the machine is powered up or shut off.
The facility uses fifteen (15) Filtech Laser Coolers. Each cooling unit consumes 20 cfm each at 30 psi with 1/2” tubing venting. Most cooling units run 80% of the time - even if the line is down. Current peak demand with 15 units x 20 cfm is 300 cfm at 80% usage or 240 cfm average demand. According to plant personnel, these units were running even when the line was down for cooling. If we consider a normal operation of the Packer or a device or part of the line, depending on the product being packaged (6 pack, 12 pack, case, etc.), the estimate of average usage is 30% of the Packager.
By shutting off cooling air flow when the process is off, the utilization factor will go from 80% to 30%. Air demand will go from an average flow of 240 cfm to an average of 90 cfm, making a net average savings of 150 cfm. We recommend a 10-minute delay after shutdown for additional cooling.
 |
||
Reduce Blow-off and Open-Blows
Many of the open-blows have been added as an “air assist” while the blower, used successfully in the past, is turned off. The energy to create blower air is only 15 to 25% that of high-pressure air (90 psig). Most of the blowers we reviewed appeared to be severely fouled and also in the blow tube or air knife. This, of course, will not only lead to less effective blow-off, but is also a major cause for a blower running hot, leading to premature failure.
We recommend that the facility convert all the listed blow-offs back to the original blower air - after the blower and tools have been maintained and returned to a useful state. This will remove the air-assist equipment from the line. If some of the blow-offs we labeled as “use blower” will not work on lower pressure, high-volume air, then install an appropriate Venturi air flow including the nozzle unit.
Remove the air-blows that are not required. Use existing air blower knives after cleaning. If the blows are still necessary, use air amplifiers to start and cut-back pressure. Most open blows should be able to be removed or changed to small blower air.
If the application must use open-blows, these units need to be set on a photo eye and also use a 25:1 air amplifier. By starting with a small 25:1 fixed amplifier first, a nozzle will use about 7 cfm at 80 psi instead of 30-40 cfm. The blow guns and extra nozzles will make all blow guns OSHA-approved and should do a better job of blowing the plant product.
 |
||
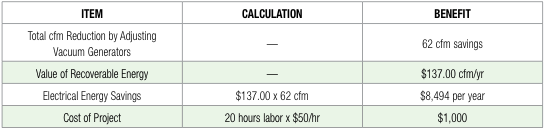
Vacuum Generator Adjustments
In order to create a vacuum, some kind of air pump or vacuum pump is required to evacuate the volume. There are two basic approaches to accomplish this task: mechanical pumps and vacuum generators (or ejector pumps). Vacuum generators are selected for more localized or “point-of-use” vacuum applications that require smaller volumes and faster local response times. Manufacturers of production machinery often supply them as standard equipment. There are two basic types of ejector pumps: single-stage vacuum generators (less efficient) and multi-stage vacuum generators (more efficient).
The facility has fifty (50) single-stage vacuum generators installed on case packers, debaggers, case packers, labelers, and other equipment. These single-stage vacuum generators use compressed air by accelerating the air through the restrictor tube to create a Venturi effect to evacuate the required volume of air. Typically, this type of vacuum generator has a ratio of compressed air consumption (scfm) to vacuum flow (the rate at which atmospheric pressure is removed from a system) of no better than 1:1 and sometimes as high as 2:1 or 3:1. These units have a ratio of 1:1 and with the modifications listed below, we can improve this ration by reducing their compressed air consumption by 62 cfm.
- Packer: change the solenoid to the air side instead of vacuum on cam. When the unit is on, it runs 100% (12 cfm x 2) at 90% utilization – demand is 22 cfm. Change air reduction at least 50%. Savings is 12 cfm.
- On the Lift Case: the generator runs 100% of the time even when not running boxes. Total reduction is 70%. Savings is 8 CFM.
- Debagger is also breaking vacuum, which is not on air side. Demand is 24 cfm. Savings is 12 cfm.
- Lid Debagger has two units running the same as above with break vacuum not on the compressed air side on all can lines. These units run at 80% utilization. Demand is 40 cfm for a savings of 50%. Savings is 20 cfm.
- Jones Stacker is running vacuum at 80% with the break vacuum not on the air side. Demand is 10 cfm and the solenoid should be moved. Savings is 5 cfm.
- Case Packer unit is breaking vacuum instead of air side. Move solenoid. Savings is 5 cfm.
The palletizer and depalletizer areas are candidates for small centralized vacuum systems. This should be evaluated in a “phase 2” project.
 |
||
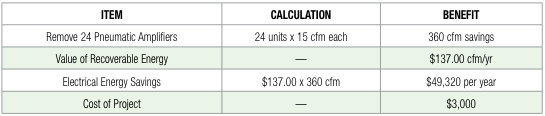
Pneumatic Air Amplifiers (Boosters)
When the plant lowered its pressure on a continuing basis to the current 72 psig target, many good things happened, particularly when the plant processes received a stable operating pressure. However, in some cases, the lowered pressure apparently had a negative impact on production and quality and these pneumatic amplifiers were installed to deliver higher pressure to several locations in the production lines. Discussions with various plant operating personnel indicate that at a system pressure of 80 psig, none of these amplifiers would be needed.
We observed twenty-four (24) Haskall MPS pneumatic boosters in use throughout the plant in the different production lines. Most of these units are the 20-cfm size. This means they deliver 20 cfm at twice the intake pressure, but will require a total of 40 cfm to run. At least half of these units are not operating at full speed, and will therefore consume somewhat less air. To estimate the impact of this project on the air system, we will use an average of 15 cfm delivered (or 30 cfm consumed) for all 24 units. The total reduction in compressed air use will be 360 cfm. At the current value per cfm of compressed air, eliminating the amplifiers will produce energy savings of \$59,486 per year.
 |
||
Conclusion
This case study is a perfect example of a factory which “did not have any issues” with compressed air. Plant pressure was stable, air quality was good, and production was never affected by compressed air. The only issue was that they were paying \$364,211 more than necessary in electricity costs to power the compressed air system! A thorough supply- and demand-side system assessment was the solution.
For more information please contact Hank Van Ormer, Air Power USA www.airpowerusainc.com.
To read more Food Industry articles, visit www.airbestpractices.com/industries/food.