Most energy-improvement stories start with a capital request – new equipment, a major retrofit or a control system upgrade. Those projects can be valuable, but they’re not always the fastest path to better performance, and they’re rarely the reason results stay in place year after year. At John Deere’s Paton, IA, facility, the most durable gains came from something less glamorous: tightening everyday operating discipline, building clear ownership and using simple, repeatable checks to confirm our systems were behaving as expected.
Improvements were not tied to a single shutdown or a one-time event. They accumulated because the team made energy and reliability part of normal work.
This article shares the approach, practical lessons learned and kinds of evidence we used to keep the gains real. Compressed air is used as a detailed example because it touches so many parts of production, but the same discipline was applied across other electrical loads such as dust collectors, ventilation fans, lighting and supporting systems.
At the Paton facility, operations focus on building large-scale agricultural planters used in row-crop production. The work brings together a wide range of processes including metal fabrication, welding, machining, assembly, surface preparation and powder coating, all within a single operation. Compressed air supports these processes every day. It powers tools and actuators, assists with material handling and ensures production-support systems such as dust collectors and indoor air quality equipment operate reliably and consistently in the background.
.jpg)
The John Deere facility in Paton, IA.
The facility encompasses approximately 300,000 square feet and operates on a single production shift rather than a continuous 24/7 schedule. Once the shift ends, production activity slows or stops, creating clear periods of reduced demand. These natural pauses in operation helped highlight where systems continued to run beyond what production required, providing a practical starting point for improving control, alignment and consistency across the plant.
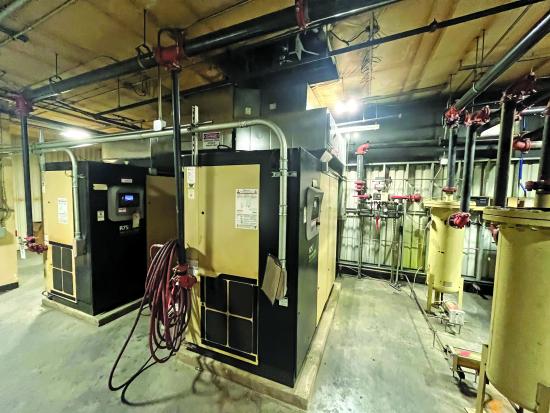
The facility’s compressed air system includes dual oil-flooded rotary screw air compressors, along with compressed air dryers and coalescing filters, configured so one system operates while the second remains available as backup.
Systems that Worked, but Didn’t Always Work Wisely
Before we changed anything, the facility met production needs. The challenge was variability and unnecessary run time. In early 2024, the electrical team noticed consistently high consumption levels, along with recurring equipment issues linked to harmonics and continuous operation. That concern led to an Energy Treasure Hunt Assessment, which formally began on March 14, 2024, starting with the compressed air system and expanding to lighting and industrial fans over the following three weeks.
Even before that assessment, the electrical profile showed a pattern difficult to ignore. On some weeks, it looked stable; on others, it carried a stubborn baseline load even when production was light, or the plant wasn’t running production or was unoccupied. This pattern wasn’t caused by a single broken component. Instead, it had developed gradually through normal equipment left running “just in case,” setpoints creeping upward over time and maintenance issues tolerated because their impact wasn’t immediately visible.
A key turning point came when the conversation shifted from “How much does this cost?” to “What behavior do we expect when demand is low, and do we actually see it happening?” That change in mindset made it easier to focus on operational controls that were low-cost, quick to implement and easy to verify, while still supporting production requirements.
The findings from the assessment were consolidated into a report issued on February 27, 2024. What stood out was not a single major failure, but a consistent pattern of systems running longer than needed. These results set the stage for a corrective action plan, with the objective of implementing improvements ahead of the next building season in July 2024.
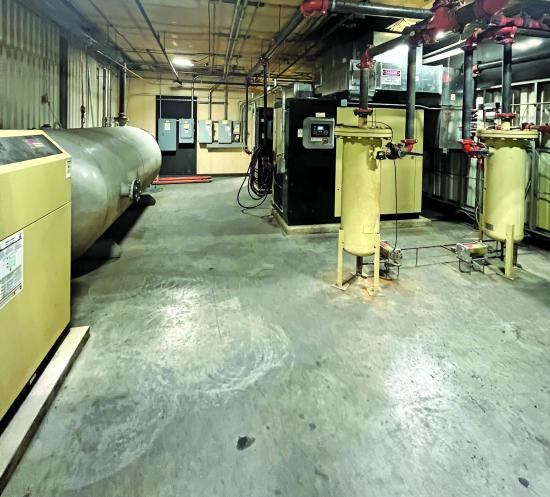
The facility’s oilâflooded rotary screw air compressors discharge 100-125 psig (6.9 to 8.6 barg) compressed air to a horizontal wet receiver tank, with downstream compressed air dryers, filters and overhead piping supplying plant air for CNC laser cutting, powder coating and assembly operations.
A Practical Starting Point: Focusing on What We Could Control
A facility Energy Treasure Hunt effort helped focus attention on opportunities hiding in plain sight. Rather than uncovering a single large issue, the review highlighted patterns in how equipment operated, particularly during off-shifts and weekends. Systems such as dust collectors, overhead fans and lighting often ran outside true demand windows, not because they were needed, but because schedules and expectations hadn’t been clearly defined.
This behavior became more visible when we looked at daily demand trends over time. As shown here, the electrical profile before changes were made showed noticeable variability and a persistent baseline load, even during periods when production activity was reduced or the plant was unoccupied. After operational schedules and shutdown expectations were aligned more closely with actual demand, the profile became more consistent, with clearer separation between production and non-production periods.
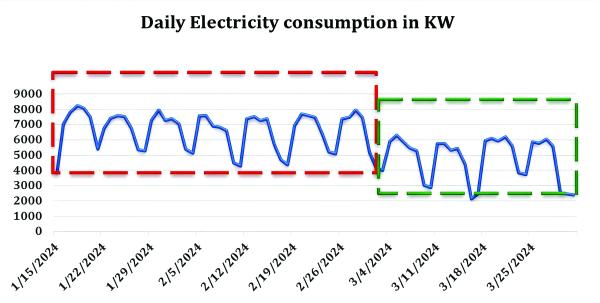
Daily electrical demand profiles illustrate reduced baseline load and improved stability following the alignment of equipment schedules and shutdown expectations with actual production demand.
These observations created momentum, but the long-term value came from what followed. Expectations were written down, ownership for each control was clearly assigned and a simple habit of reviewing trends was established to confirm the plant was behaving the way the plan intended. Instead of relying on assumptions, the team could quickly see when equipment was running as expected and just as quickly identify when it was not.
What Changed: Turning Observations into Daily Discipline
Once those early opportunities were visible, the focus shifted from identifying issues to making sure the changes would hold. We didn’t chase a perfect model or a single project. Instead, we concentrated on a few practical behaviors that could be repeated every day and applied across systems.
Operating expectations were clarified first. We defined what should be running during production, what needed to be ready for startup and what should be shut off during inactive periods. Just as importantly, ownership was established. Someone had to own the schedule, ensuring the right operating hours were communicated clearly so the facilities and maintenance teams could program, service, align equipment with production needs and follow up when something drifted from plan.
Verification tied everything together. Reviewing trends became a simple habit used to confirm the plant was behaving the way the plan intended. When the data didn’t match expectations, it was treated as a signal to learn and adjust, not as a failure. That mindset helped turn early momentum into lasting change by keeping the focus on understanding how systems operate day-to-day.
This same approach was applied across multiple systems, but compressed air quickly stood out as the clearest example because it’s both energy-intensive and production-critical.
Compressed Air as a Production-Critical Asset
At Paton, compressed air is provided by two 75-horsepower oil-flooded rotary screw air compressors serving the entire facility, with system distribution pressure maintained at approximately 110 psig (7.6 barg). These air compressors are industrial continuous-duty units designed for high reliability and stable airflow under varying production demands. Unlike reciprocating air compressors, rotary screw air compressors use intermeshing helical rotors to deliver a steady, pulse-free supply of compressed air with lower vibration and noise levels. The oil-flooded design provides internal cooling, sealing and lubrication of the compression chamber, improving efficiency, reducing wear and supporting long operating intervals in demanding manufacturing environments.
The air compressors support a centralized compressed air network powering production tools, pneumatic actuators, indoor air quality (IAQ) systems, dust collectors, hydraulic support equipment and the powder-coating process. Because compressed air is both energy-intensive and production-critical, system reliability depends not only on the air compressors themselves, but also on proper scheduling, pressure control, monitoring, condensate management, filtration and preventive maintenance practices.
Early on, our understanding of the compressed air system was largely based on physical observation and maintenance history. At that time, no formal monitoring system was in place, and access to live operating data was limited. That meant issues were often identified only when something became visible during inspection or service, rather than when performance first began to drift.
This began to change in early 2024, after repeated repair events and ongoing concerns from the electrical team related to high energy consumption, harmonics and continuous operation. Around that same time, we were already using an Ignition-based platform on other systems that depended on compressed air, such as dust collectors, a powder coating booth and hydraulic pumps. Those systems gave us visibility into how the equipment behaved, but not into the air compressors supplying them, which made it difficult to see the full picture. As we started looking for ways to monitor the air compressors directly, we found the capability was already there; we just weren’t using it. After reaching out to our service contractor, we confirmed an existing monitoring interface had been installed but not put into operation. With some configuration support and team training, we brought the system online so maintenance and facilities could access real-time data such as pressure, electrical demand, system status, alarms and schedules.
Once implemented, the system provided visibility into key performance indicators such as system pressure, air compressor run status, electrical demand, alarms and operating schedules. It also allowed limited remote access to review system behavior and confirm whether or not the air compressors ran as expected. With visibility in place, the way we approached the system changed. Instead of relying solely on physical checks and reactive maintenance, we observed trends, identified abnormal behavior earlier and focused troubleshooting efforts more precisely.
What had previously been a reactive process became more predictive in nature. The team could now see how the system responded to production demand, recognize when something was drifting from normal behavior and take action before it developed into a larger issue. Just as importantly, it gave us a way to verify scheduling and operational expectations were actually being followed, reinforcing the same discipline was being applied across the rest of the plant.
One example was a worn and leaking component on the air compressor discharge piping discovered during service. The condition itself wasn’t dramatic, but it was enough to introduce instability into the compressed air system and increase the effort required to maintain pressure. Situations like this highlighted an important gap: While maintenance teams addressed what they could see, we could not yet consistently observe how the system behaved over time.
.jpg)
A worn and leaking compressed air system component was identified during routine service. While the condition was not immediately disruptive, it contributed to system instability and highlighted the need for better visibility into long-term operating behavior.
That changed once the compressed air monitoring system was set up and access was established. With visibility into compressed air system behavior, we could see when the air compressors were running, how the system responded to production demands and whether or not schedules were being followed. This allowed the team to confirm the system was operating as intended, running during production hours, shutting down during non-production hours and maintaining stability without risking air availability for production.
_0.jpg)
.jpg)
Monitoring data verified compressed air operation aligned with production schedules, maintained stable pressure and avoided unnecessary run time during idle periods.
At the same time, the data supported better preventive maintenance planning. Instead of reacting to issues after they became noticeable, the team could identify abnormal patterns early and address them before they affected reliability. This combination of physical maintenance, clear scheduling and verified operation reduced the risk of unexpected interruptions while reinforcing confidence compressed air would be available when production needed it.
Extending the Same Discipline Beyond Compressed Air
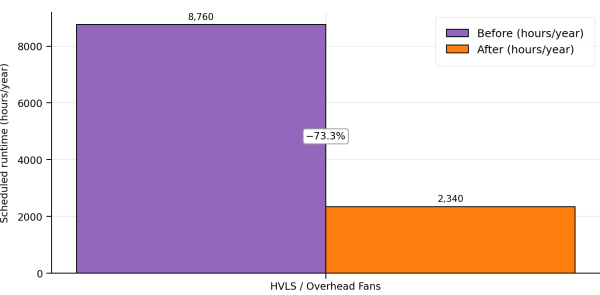
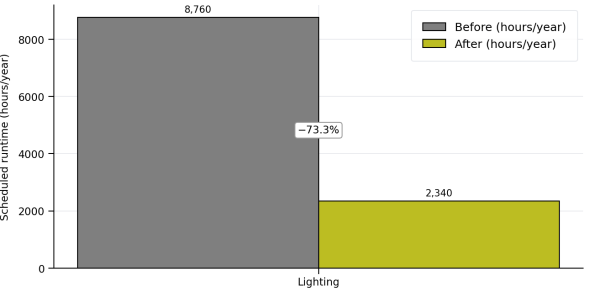
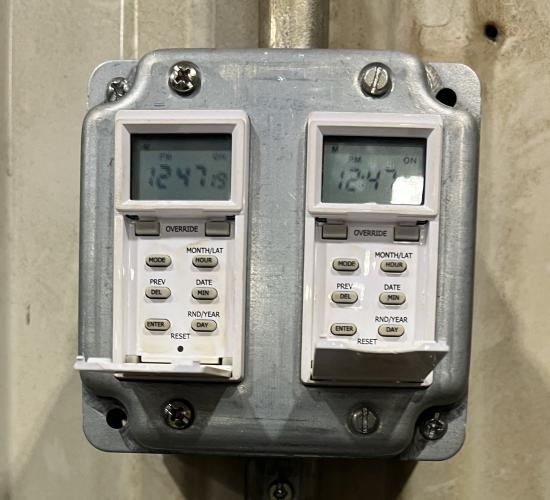
Once compressed air demonstrated how effective clear schedules and verification could be, the next step was applying the same thinking to other loads where behavior (not equipment design) drove unnecessary demand. Systems such as dust collectors, overhead fans and lighting showed similar patterns. This process took place after July 2024, as efforts shifted toward expanding the approach beyond individual systems to include a broader set of assets tied directly to production hours and overall plant operation. They were reliable and familiar but often operated longer than production required simply because expectations were not clearly defined or consistently verified. In many cases, the solutions were straightforward: time-based controls for lighting, replacement of legacy fixtures with LED lighting and automated schedulers aligned to production hours rather than fixed assumptions.
%20copy.jpeg)
_0.png)
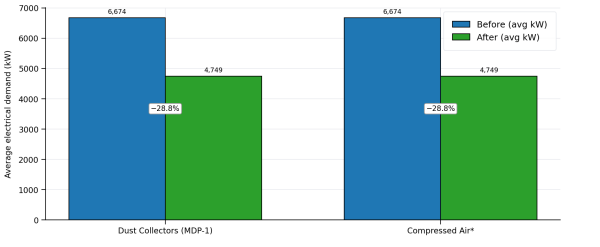
Scheduling and control interfaces used for dust collectors, IAQ systems, ventilation fans and lighting. Time-based controls were aligned with plant operating hours to reduce unnecessary runtime while maintaining production readiness.
Supporting systems with tighter quality or safety constraints required additional care. Assets such as IAQ equipment, the powder coating booth and manual blast operations directly support welding and paint processes, where unintended changes could affect product quality or disrupt production flow. For these systems, schedule adjustments were approached cautiously. Safeguards were built in, access was actively managed and behavior was monitored to ensure waste was reduced without introducing risk. These changes began in 2025 and were validated against production needs before being fully adopted, ensuring efficiency improvements never came at the expense of reliability.
Rather than relying on memory or informal shutdown practices, these systems were deliberately aligned to how the plant operated. Automatic schedules were paired with clear end-of-shift expectations, so equipment behavior was consistent day-to-day. This consistency mattered. When systems followed predictable patterns, it became easier to confirm changes were being held, identify when something drifted and correct items early. Over time, disciplined operation reduced the need for reminders and made efficient behavior part of normal work.
Following a maintenance and operations workshop in 2024, a digitalization process was introduced to support this approach. Monitoring played a key role in sustaining these improvements. Both the maintenance and facilities teams were given access to the digital platforms supporting each asset, as well as direct access to the physical equipment. This ensured those responsible for systems could see real-time behavior, review trends and connect what the data showed with what was happening in the field.
To further integrate the broader plant community, a facilities and maintenance service request tool was established in May 2025. What had once been informal favors or hallway conversations became a structured, trackable process. Requests, observations and follow-ups were captured in one place, turning everyday needs into actionable information.
Over time, this tool became more than a request system; it became a way to document behavior, track responses and ensure no issue, large or small, was lost or overlooked. The result was a repeatable approach respecting the unique role of each asset, strengthening collaboration across teams and reinforcing confidence operational improvements would hold over time.
In 2026, as part of a continuous improvement effort, feedback from the production team highlighted the need for more immediate and transparent communication regarding service requests and facility support. In response, an enhanced digital tool was launched to provide multiple facilities and maintenance service options, supporting team needs throughout the production process. Requests such as janitorial services or snow removal were formalized into a system communicating progress to the requester while also capturing critical data. This information allowed the team to continuously improve internal processes and increase overall reliability.
Across these combined efforts, the impact became measurable in reduced electrical demand and total energy consumption. Breaker-level analysis associated with dust collector scheduling improvements indicated an annual reduction of approximately 702,395 kWh. Additional schedule alignment actions contributed further savings, including approximately 70,200 kWh per year from overhead fan (HVLS) scheduling and an estimated 373,338 kWh per year from lighting timers, controls and reduced runtime. In total, these documented improvements represent a combined reduction of approximately 1.15 million kWh annually, achieved primarily through operational discipline, scheduling and verification rather than major capital investment.
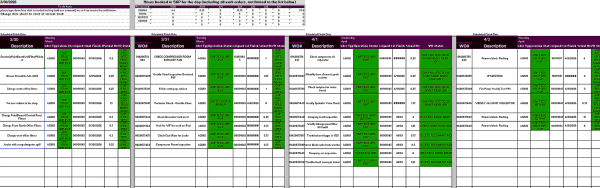
Planning and request tools used by facilities and maintenance teams to coordinate schedules, document operational needs and ensure expectations were clearly communicated and consistently followed. Click to enlarge.
Closing Thoughts
These results were achieved by actively reviewing and stabilizing multiple utility systems, not by relying on a single technology solution. Energy was managed as an operational outcome through clear schedules, defined ownership and routine verification. To sustain these gains, the focus now is on strengthening preventive and predictive maintenance systems, ensuring longâterm performance, reduced risk and continued reliability of productionâcritical assets such as compressed air.
About the Author

Jose Sarmiento Escalante is a Facilities and Maintenance Engineer II at John Deere, where he supports manufacturing operations and infrastructure performance in Paton, IA. His work centers on reliability engineering, maintenance strategy, safety, capital project execution and sustainable energy optimization, with a focus on driving operational excellence across critical utility and production systems. He’ll present this case study at the Best Practices 2026 EXPO & Conference, held October 13-15 in Indianapolis, IN. For more information, visit https://cabpexpo.com.
About John Deere
John Deere designs and manufactures equipment and solutions supporting agriculture, construction, forestry and industrial applications. The Paton, IA, facility supports manufacturing operations and continuous improvement efforts focused on safe, efficient and reliable production. The site’s primary manufacturing focus is on agricultural planters, producing large-scale planting equipment used in row-crop operations. For more information, visit https://www.deere.com.
To read similar Corporate Sustainability articles, visit https://www.airbestpractices.com/energy-manager/corporate-sustainability-programs.
Visit our Webinar Archive to listen to expert presentations on Air Compressor Technology at https://www.airbestpractices.com/magazine/webinars.