Introduction
A Tier 1 automotive plant was spending \$364,259 annually on electricity to operate their compressed air system. This figure was expected to increase as electric rates were forecasted to rise from their current average of 7.16 cents per kWh. Our firm, Air Power USA, conducted a full supply and demand-side compressed air system assessment. The set of projects recommended by the assessment, would reduce these energy costs by \$218,670 or 60%. These projects would also allow the plant to have complete back-up of all of its compressor rooms. Estimated costs for completing the projects totaled \$244,795, representing a simple payback of 13 months.
It is important that compressed air system owners understand that reducing compressed air demand (like fixing compressed air leaks) will not automatically translate into energy dollars saved. This facility, for example, did not have a networked compressor control system capable, of translating the achieved compressed air demand reductions of 1,300 acfm into energy savings for the plant. This article’s primary objective is to share, with the readers, the metrics we supply our customers so they can understand the current compressor usage (without centralized controls) and the proposed compressor usage (with networked controls).
Current Compressed Air Supply-Side Summary
This automotive component plant runs three production shifts per day, five days a week and a half day shift on Saturday. Weekly non-production hours total 21 hours per week. The compressed air system, however, operates 8,760 hours per year. The load profile or air demand of this system is not relatively stable during all shifts. Overall system flow ranges from 2,009 acfm during weekends to 3,300 acfm during the first and third shift. The system pressure runs from 83 to 92 psig in the headers during production.
Annual plant electric costs for air production are \$291,818 per year. If the electric costs of \$72,441 associated with operating ancillary equipment such as refrigerated and desiccant air dryers are included, then the total electric costs for operating the air system are \$364,259 per year. These estimates are based on a blended electric rate of \$0.0716 /kWh.
Multiple Compressor Rooms Create Confusion and Energy Costs
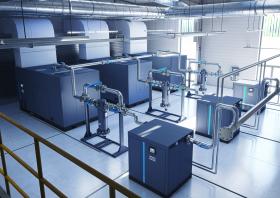
The plant has five (5) different compressor rooms supplying compressed air to different parts of the factory. All five compressor rooms operate independently of one another. Each compressor room has a combination of air compressors and air dryers operating during each production shift. There existed total confusion, with plant personnel, on how much compressed air each compressor room is supplying. Our study provided the plant with an analysis of each compressor room – along with a drawing of the existing equipment installed.
Compressor Room “126E”, for example, operated the following three air compressors and one compressed air dryer. Compressed air filters and a 1,060-gallon storage tank was also installed. There was:
- One 100-hp lubricated rotary screw air compressor rated for full-load 520 acfm and 85 kW at 100 psig pressure. This machine ran at full load during normal production and non-production hours.
- Two 50-hp lubricated rotary screw air compressors rated for 240 acfm each and 42 kW at 100 psig. One 50 hp machine acted as back-up while the other operated at 73.5% of full load during the first shift (176 acfm), was OFF during the second shift, and ran at 40% of full load (96 acfm) during the third shift. These two compressors did not run during non-production hours
- Total available compressed air at 100 psig equaled 1,000 acfm
- One cycling refrigerated air dryer rated for 1,300 acfm. Specified compressed air pressure dewpoint at compressor room exit was + 40 °F
- Pressure loss at 520 acfm equaled 5 psid
Current Compressor Use Profile
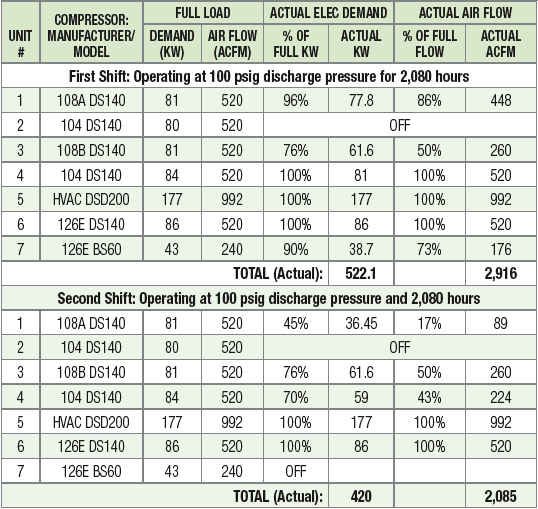
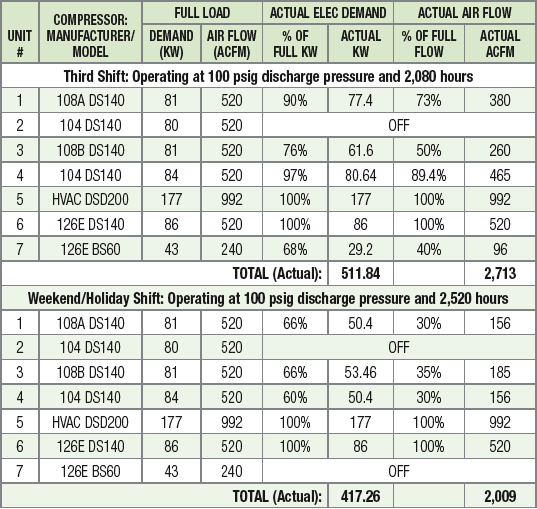
Once we had measured and analysed what was happening in each compressor room, we put all the data together into one table. We now look at what is happening with each air compressor, by production shift. It’s important to note that we measured what was happening on the weekends and holidays as well. Remember, each compressor room was operating independently of one another.
| Table 1: Current Compressor Use Profile |
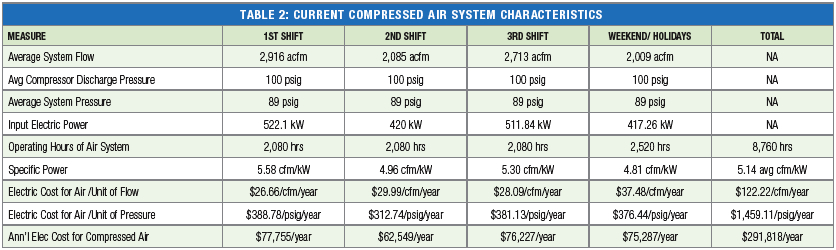
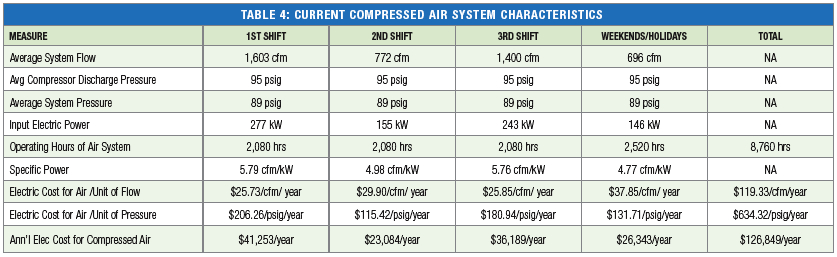
Current Compressed Air System Characteristics
Once the compressor use profile had been established, by shift, we could develop an over-all picture of the performance of the compressed air system. We could analyze total system air flow, by shift, and figure out our annual electric costs for compressed air – by shift.
Proposed System: Compressor Use Profile by Shift
The demand-side projects were able to realize significant reductions in compressed air demand – up to 1,300 acfm. The plant, however, would not realize these gains without a new networked compressor control system allowing all the air compressors to work together. The table below showed the customer how the new networked system would work.

Proposed Compressed Air System Characteristics
As before with the current system characteristics, the proposed compressor use profile allows us to show the customer what the new system will look like – and the energy savings that will be realized. Providing the customer with the over-all picture, by production shift, allowed the customer to have the confidence to invest in the networked compressor control system needed. Otherwise, the reductions in air demand would not have been translated into energy savings.
Final System Comparison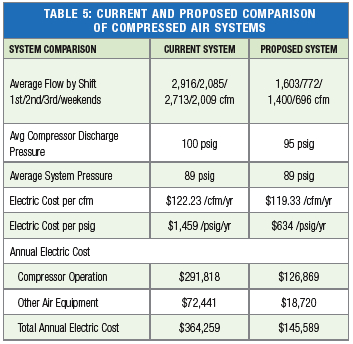
Customers often appreciate an executive summary. We will often combine the current and proposed system tables into one. Below is an example of the one we supplied to this automotive plant.
Conclusion
The demand-side projects identified include implementing a leak management system, installing automatic shut-off valves on equipment, and addressing inappropriate uses of compressed air. The benefits to the facility are a compressed air use reduction of 504 scfm translating into a potential energy savings of \$70,056 per year.
For more information please contact Hank Van Ormer, Air Power USA, tel: 740-862-4112, email: [email protected], www.airpowerusainc.com.