A Canadian poultry plant has upgraded their aging compressed air system for their new expansion, making it significantly more energy efficient and also solving ongoing pressure problems. The project has given the facility a much better system overall and increased system capacity enough to cover additional compressed air load. This article describes what was done to improve their compressed air system.
Background
The company is a farmer owned cooperative that has been operating for over 50 years. The production output of the facility is currently over 100 million pounds of chicken and poultry products per year. The plant and the compressed air system has grown from a smaller size over the years as the production facility got bigger and added more compressed air powered tools and machines.
As a result, before the last expansion the plant had four small compressors sized between 25 and 40 hp running in various modes of operation. The compressed air was conditioned using particulate filter and non-cycling refrigerated air dryer.
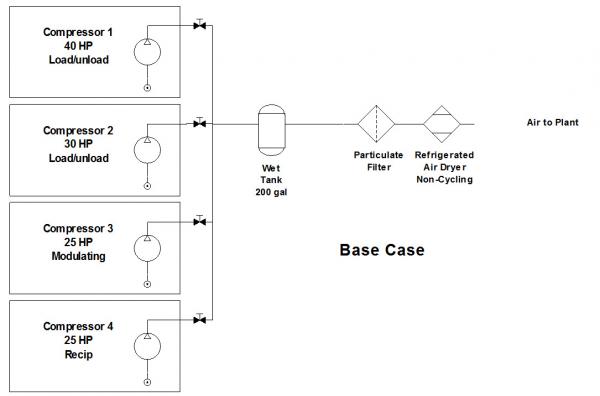
Figure 1: The as found system configuration used multiple smaller compressors
Initial Assessment
Supply side measurement of the system was initially done in 2001, when the plant was much smaller, by placing amp and pressure loggers on the compressed air equipment to assess the production efficiency and determine if any problems existed. At the time only two 25 hp screw compressors were being used, both of which were running in modulation. Figure 2 shows the plant pressure was unsatisfactory, varying between 72 and 132 psi and the power consumption was very flat, even with varying load.

Figure 2: The original smaller system used two modulating compressors - Click here to enlarge.
Modulation Complicates Estimates
Modulation control of screw compressors is problematic for system auditors because the amp or power input changes very little for a large change in flow. In properly assessing a system, in the absence of flow meters, the auditor must try to accurately estimate the flow of each compressor based on the reduction of amps when the compressor starts modulating to reduce its output. This estimate is important because it often determines the size of any replacement compressor. Typically, the auditor uses a curve similar to Figure 3 and does a straight-line approximation based on the amp information at various points along the system profile. Unfortunately, due to their age and poor condition, the actual system compressors at this location do not exactly follow a curve such as this. In addition to this, there is something else happening to the compressors. Due to the system flows exceeding the capacity of the compressors, the compressors are often running in a condition called 'drawdown.' This happens when the compressor is at maximum output capacity, but the system demand pulls the pressure lower than the compressor set point. This condition also causes reduced amps/power. This means an amp reading lower than full load conditions can mean two things; 1) the compressor is at full load and in drawdown, or 2) the compressor is modulating and at reduced capacity. This complicates the estimating process and makes flow estimating inaccurate.
At the time of the assessment, based on the amp readings, the system flow was estimated at 260 cfm peak and 120 cfm average. Power consumption was estimated at 43 kW consuming about 374,500 kWh per year. System specific power was estimated at 36 kW/100 cfm, a normal reading for an optimized system would be around 20 kW/100 cfm.
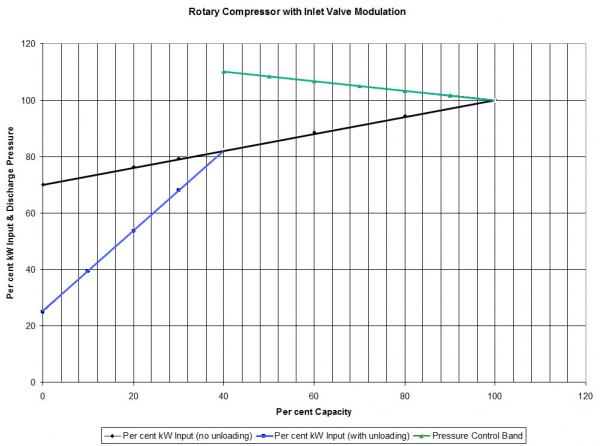
Figure 3: Curve used to estimate a typical modulating compressor output flow (Sources Compressed Air Challenge)
Plant Adds Fixed Speed Units
After this first assessment the plant did not decide to fully optimize their system, they simply added another 40 hp compressor, replaced a 25 hp unit with a 30 hp unit, and altered the compressor control settings to ensure any base compressors ran fully loaded and one compressor trimmed in load/unload mode. They also tied in another 25 hp reciprocating compressor for backup duty. As time went on another system assessment was done, this time with a flow meter installed. The new readings showed operating with load/unload control rather than modulation, did actually make the system more efficient. It now only consumed 47 kW for an average flow of 160 cfm, resulting in a system specific power level of 29 kW/100. However, this was still a higher level compared to optimum.
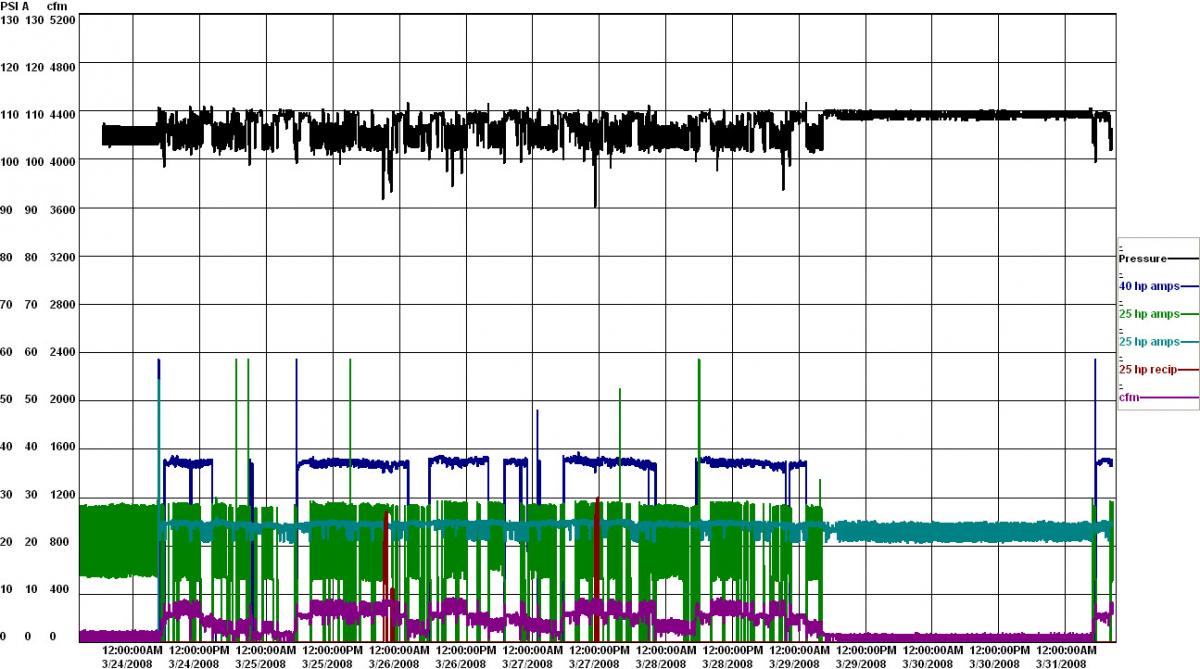
Figure 4: Adding another compressor and changing operating mode improved pressure and efficiency - Click here to enlarge.
Full Optimization
About the time of this second assessment, the plant started making plans for an additional production expansion which required more compressor capacity. Plant management decided to strive for full optimization by upgrading their system to include a new variable speed 100 hp VSD unit. Since there were utility incentives available, management also considered some other items:
- A cycling air dryer was chosen to reduce the power required during loads that were less than the full capacity of the dryer. Since average flows were 120 cfm and the actual dryer capacity was to be 500 cfm, the dryer was on average only 24 percent loaded. A non-cycling dryer would have consumed almost full power during these low load periods.
- A mist eliminator coalescing filter was installed before the dryer to remove oil carryover and free water from the airstream before it entered the air dryer. Compared to a standard filter, this ME style has between ½ psi and 3 psi pressure differential over the life of the element instead of between 3 to 10 psi for a standard filter. This reduced differential allows lower compressor discharge pressure, reducing the overall compressor power consumption.
- Airless condensate drains were installed to reduce the compressed air wasted by old style timer drains.
- A pressure/flow controller was installed to reduce the plant pressure to a minimum level, but allow an adequate compressor control band to switch compressors in and out as the demand changed. Most of the installed machines in the plant do not use pressure regulators. For these machines, and for leakage, every one psi in reduced average system pressure results in a corresponding 0.9 percent reduction in flow. This reflects back into reduced compressor power consumption due to the reduction of artificial demand.
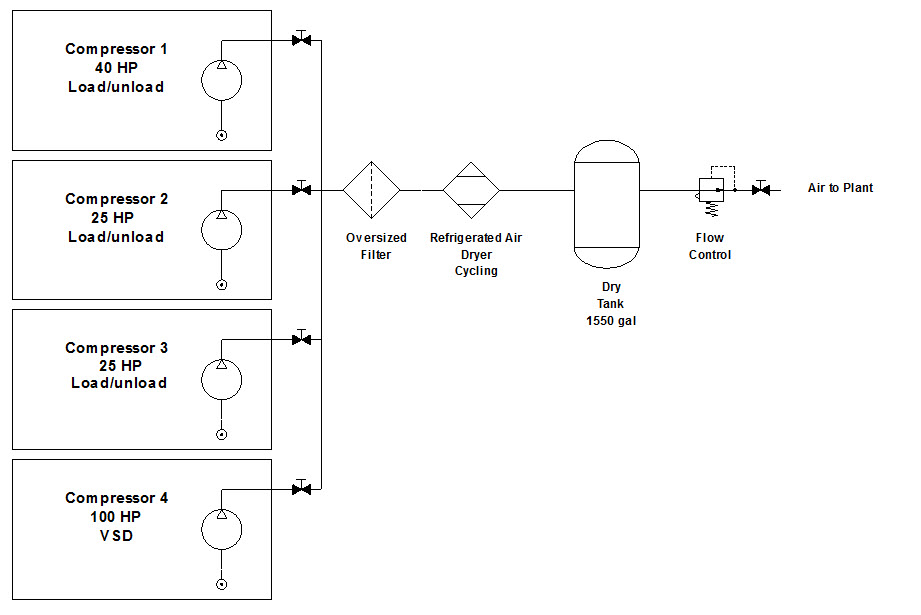
Figure 5: Final configuration after improvements
Project Results
The power utility required a verification logging for this project before paying out the incentive. Once again data loggers were placed on the compressed air system to determine the power, flow and pressure characteristics and to ensure the expected savings had materialized.

Figure 6: Final Operating Profile - Click here to enlarge.
The captured readings showed plant pressure was much better regulated after the upgrade, but had some low pressure events due to compressor pressure settings issues (this was corrected). Overall, with the exception of a few occasional peaks, the 100 hp VSD compressor carried the whole plant with the 40 hp compressor coming on at full load during occasional peaks. Due to the plant expansion, the average flow had increased substantially to about 220 cfm. The average power consumption during this period was measured at 44.1 kW. System specific power was now about 20 kW/100 cfm, a reduction in power consumption per unit of compressed air produced of 44 percent. The actual energy consumed by the system was 343,600 kWh, slightly lower than conditions when the two 25 hp compressors were running, yet producing about 40 percent more compressed air.
Potential End Use Improvement
One downside to this project is the lack of attention to end uses and waste. When verification was being done the compressed air auditor noticed a few items that could be addressed that could potentially reduce their overall system energy consumption:
- The plant experienced a number of motor failures on production machinery due to water entering the motor housing during sanitation washdown. Some of these motors were modified by connecting them to a supply of compressed air to pressurize the motor enclosure to prevent the moisture from entering. This is seen as an inappropriate use of compressed air consuming about 40 cfm of average compressed air.
- Compressed air leakage levels had increased from the initial assessment due to lack of maintenance. The leakage could be seen on the installed flow meter during non-production hours. This was flagged and the plant reduced the leakage level by implementing a leakage detection and repair program to their maintenance program.
- The pressure/flow controller initially installed was pneumatically controlled with a pilot regulator. As can be seen on the final pressure profile (Figure 6) the regulation of the plant pressure has a number of sags during high flows. This can be improved by installing an electronically controlled pressure/flow controller. The use of this better controller would allow the further reduction of plant pressure, saving more energy due to the reduced flow.
Conclusion
This project showed the optimization of the supply side of the system could save energy, especially when converting compressor control from modulating to VSD mode. Not only was the compressor control improved, but energy savings were gained by addressing air dryers, filters, drains and reduction in plant pressure. Further reductions were also gained by addressing some end uses and leakage reduction after the verification took place.
Overall the power utility confirmed the reduction in operating costs for this system was 44 percent (not including end use reduction) saving about \$24,000 per year in compressed air operating costs at the present plant loading. The utility paid out an incentive of \$30,000 making the project simple payback of about 4 years. The project not only saved energy, but better stabilized plant pressure, allowing production machinery to operate without pressure dropouts.
For more information contact Ron Marshall, Marshall Compressed Air Consulting, tel: 204-806-2085, email: [email protected].
To read more about Air Compressor Control System Assessments please visit, www.airbestpractices.com/system-assessments/compressor-controls.
To read more about Food Industry please visit, www.airbestpractices.com/industries/food.