The Facility
This large petrochemical facility employs 400 employees and contractors. The site covers an area of almost 900 acres. Natural gas liquids are used as a feedstock at the plant to manufacture ethylene, the world’s most widely used petrochemical. The ethylene is then converted into polyethylene and polypropylene plastic resins. These resins serve as building blocks for countless products that provide the necessities of modern life, such as leak-proof and shatter-proof containers for industrial and household chemicals, packaging that protects our food from spoilage and contamination, and children's toys that are safe and durable. The plastic resins produced at the facility are sold to manufacturing companies, in the plastics industry, who typically produce a finished product.
Over the past year, the company had experienced thirty (30) “close-scrapes” with having entire sections of the plant shut down to pressure losses in the instrument air system. This is why our firm was engaged to conduct a compressed air system assessment. The experience we had, during this assessment, reaffirmed our belief that every system must be approached with an open mind. There is no single, cookie-cutter, system assessment approach that works for all facilities.
This petrochemical facility was spending \$1,110,000 annually to operate their compressed air system. The blended rate for electricity at this site was \$0.03 per kWh. Electrical energy costs were \$471,000 and compressor rental/maintenance costs were \$639,000 per year. The system assessment identified yearly savings opportunity totaling \$743,000 per year could be found with an investment of \$1.15 million. The simple ROI on the project is 19 months.
This system assessment exhaustively examined the supply and demand-sides of the compressed air system. Due to article length space constraints, Part 1 of this article will detail the improvements made to the supply-side and Part 2 will cover the demand-side projects.

Supply-Side System Overview
The main compressed air system consists of five (5) air compressors supplying both Plant and Instrument air to the site. There are two (2) main compressor rooms located in the Utilities Area and the Polymers Area.
The Utilities Area Compressed Air System
The Utilities compressor room contains three (3) compressors (C2, C3, and C4) that include two (2) 1,500 Icfm 3-stage and one 2,770 Icfm 4-stage centrifugal. All compressors in the system are oil-free and water-cooled. C3 compressor is equipped with a steam driven turbine which lets down steam required for the process. The after-coolers on some compressors are remotely mounted away from the compressor package while some are integral to the package. The quality of the cooling water is poor and therefore the coolers are susceptible to fouling. The units are installed in compressor trains where the plant air dryers are dedicated to a specific compressor.
The plant air dryers (to be covered in Part 2 of this article) are conventional heatless desiccant dryers using activated alumina as the media and compressed air for regeneration. Each dryer operates on a fixed 10-minute fixed cycle and therefore the purge requirements do not change as system demand varies. Each desiccant air dryer has a coalescing pre-filter and particulate after-filter. The pre-filters remove liquids and oils to prevent the desiccant beds from prematurely fouling. The particulate after-filters are designed to remove desiccant fines that will carry over from the dryer chambers.
The piping downstream of the dryers combines into a common 6” dry header feeding both the plant air header and the guard dryer which supports the instrument air header. The header branches to the main plant air line which is equipped with a single back pressure control valve which is designed to modulate closed in the event the Instrument air pressure falls to unacceptable levels. The back-pressure control valve does not operate automatically and has been manually closed to a 50% position. Another branch line downstream of the Plant Air dryers feed the Utilities Guard dryer arrangement. The Utilities Guard dryer is manually switched between vessels and uses nitrogen for purging. The Utilities compressor room feeds two (2) 3” Instrument air headers which connect to the Polymers area of the plant. 3” and 4” Plant air headers are run from the Utilities Compressor area to the Polymers area of the plant.
The three (3) compressors in the Utilities compressor room operate on their own local controls using inlet modulation. The set points are slightly staggered and therefore operate at various part load conditions.
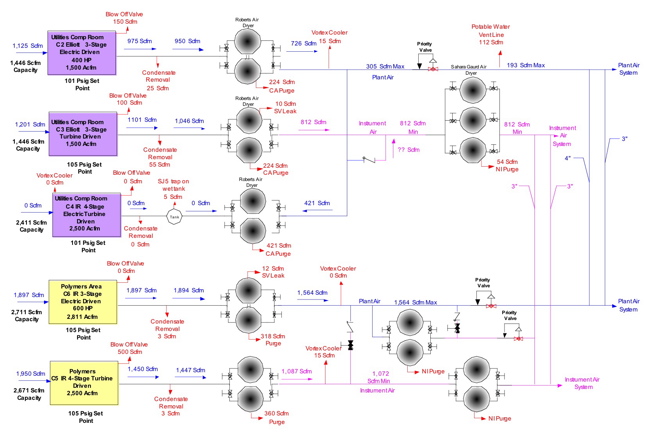
Figure 1: Installation Before the System Assessment
The Polymers Area Compressed Air System
The Polymers area contains two (2) compressors (C5 and C6) located in individual buildings. C5 is a 4-stage centrifugal rated for 2,770 Icfm and with an air end identical to the C4 compressor. C5 is equipped with a steam driven turbine and is used to let down steam for the process. The entire demand consumed by the steam turbine on C5 is not required and therefore is not always efficiently utilized. During certain times of the year, the excess steam sent to the deaerator is vented to atmosphere (up to 10,000 lbs/hr). The air produced by C5 is dried by the Plant air heatless desiccant air dryer. A molecular sieve desiccant dryer is installed downstream of the plant air dryer in order to further suppress the dew point down to -80 ºF using nitrogen as purge. A branch line downstream of the plant air dryer feeds the two main plant air headers (3” and 4”). The compressors are water-cooled with water from an open evaporative tower. Each dryer has a coalescing pre-filter and particulate after-filter. The pre-filters remove liquids and oils to prevent the desiccant beds from prematurely fouling. The particulate after-filters are designed to remove desiccant fines that will carry over from the dryer chambers. The compressor operates on its own local controls and has the ability to modulate its inlet valves based on the prevailing discharge pressure (constant pressure).
1. System Demand
During the study amperage loggers were installed on the three (3) electric driven air compressors in order to get a better understanding of the dynamics of the system load. The loading of the two (2) steam driven compressors was closely observed through the week and well documented. The performance curves for the air compressors were obtained from the factory in order to understand the power versus flow output of the air compressors based on ambient inlet conditions. During the study, compressed air consumption did not vary plus or minus 15% from the average demand of 6,173 scfm.
The collective supply side capacity of the air compressors at the prevailing ambient conditions (62F, 35% inlet) during the study was 10,945 scfm leaving excess capacity of over 4,700 scfm. Under worst-case operating conditions in the summer months, the compressed air system has 3,375 scfm of excess operating capacity. The discharge mass of the centrifugal compressors will change based on the prevailing intake conditions and cooling water supply temperatures. 38% of the total compressed air generated is consumed in the compressor room areas. With modifications to the system, a majority of the compressor room consumption can be eliminated providing additional off line capacity for the system.
Historically the site operates all five (5) air compressors if they are in operating condition. For a portion of the study, C4 compressor was down and still in the process of being commissioned after being upgraded with a refurbished airend. Operating all five air compressors at one time is not an indication of the need for compressed air. For example, when C4 was started, it proceeded to deliver un-needed compressed air to the system. As a result, several of the on line compressors removed a portion of the air generated by C4 by further opening their blow off valves which vent to atmosphere.
Completing all supply and demand side actions (covered in Part 2 of this article) will reduce the system demand by over 2,700 scfm - leaving 6,000 scfm of excess available off line capacity under worst-case operating conditions in the summer months.We project that the future demand for the system will be less than 3,800 scfm which can be supported by one machine in the utilities area and one unit in the Polymers area.
Rental Compressors
It is common for compressed air system to operate with limited monitoring points. However, the lack of collective information which can be analyzed can be costly to the site since it is difficult to make sound informed decisions. Historically, the site has rented oil-free air compressors when one of the permanent machines was either broken or being maintenance. Historical data collected from the site indicates that over the last three (3) years, the site has spent an average of \$208,500 annual on rental fees. In addition, it has cost an average of \$255,500 a year to fill the diesel engines with fuel to support the rental units. Collectively the plant has spent an average of \$464,000 a year for rental compressors and fuel.
In the short term, the plant should review the performance capabilities of each compressor based on site conditions to determine the proper course of action when a compressor is out of service. In the long term, the reduction in demand will enable the site to operate without the need of a rental compressor as long the plant does not lose more than two units at the same period of time.
Optimizing the Centrifugal Air Compressors
The age of the installed air compressors varies between six (6) and forty-one (41) years and need to be assessed for long term planning. As demand is stripped from the air system, fewer compressors will be needed in order to support the system. However, there are limitations in adequately delivering air to the entire system at a predictable and stable pressure due to the limitations of the distribution piping for the instrument and plant air systems. The cross connects between the Utilities and Polymer systems consist of the following:
• Two (2) 3” lines for the IA system
• One (1) 3” line and one (1) 4” line for the Plant Air System
The distribution piping can be upgraded in order to minimize pressure drop throughout the system. However, this option is very costly and not the best option for the site. On a reliability perspective, it makes sense to operate a minimum of one compressor in each of the respective areas (Utilities and Polymers) which will ensure a constant pressure in the main distribution headers. Since the Polymers area on has two compressors, it is critical that there is a reliable backup unit. However, C5 compressor historically has been unreliable due to the steam driven turbine and therefore should be addressed first. C3 compressor also is equipped with a steam turbine and is used to let down stream to a lower pressure for the process. The process uses the entire let down steam from C3 compressor and therefore only power cost associated with this machine is associated with the seal losses during let down. However C3 (and C2) are the “weak links” in the system since they are rated for 105 Psig discharge and contain well worn aluminum impellers. For these reasons, changes to C3 are warranted and are a priority in the short term plan.
C5 Compressor
C5 compressor has experienced reliability issues due to the steam-driven turbine. We estimate that the turbine is consuming 35,000 lbs/hr and consumes about 2,000 lbs/hr in seal losses. The process requires the let down steam for a majority of the year. However, for about 1,500 hours a year a portion of the let down steam (about 10,000 lbs/hr) is not required for the process and therefore is returned to the dearator where it is vented to atmosphere. Including the seal losses, the losses are 12,000 lbs/hr. At a steam generating cost of \$5.48/1000 lbs, the annual cost to vent excess steam due to C5’s steam turbine is \$98,550. Over the last three years, the average annual cost to maintain and repair the steam turbine has been \$49,194. The annual cost to operate C5 compressor including wasted steam, maintenance, and repairs is \$147,744.
There is some variation in the volume of let-down steam from the compressor turbine and therefore can affect the production operation. In the future it is critical that the compressor is configured to automatically start and stop in the event of a primary compressor failure which will be difficult and expensive with the steam turbine. The cost to operate an electric driven compressor will be less compared to the C5 steam driven compressor. For process stability, system reliability, and operating costs, it does not make sense to keep this compressor on a steam driven turbine.
In the long term, the system will require operating one of the compressors in the Polymers area. In order to maintain a high degree of reliability, we propose replacing this compressor with an electric driven compressor. The existing compressor can be converted to an electric driven compressor but will require extensive modifications that have been estimated to cost close to \$200,000. The airend on C5 is identical to the C4 compressor - which is a newly refurbished 4-stage unit. Years down the road, there is a high likelihood that C4 compressor will have to be re-worked. The cost to repair a damaged 4-stage unit can be over 50% of a new compressor and therefore will most likely not make sense to complete. Under the sites unique circumstances, we believe it makes sense to remove the existing C5 compressor and replace it with a similar sized 3-stage, centrifugal compressor rated for a discharge pressure between 115 Psig and 125 Psig. The capital cost to purchase a 500 HP electric driven centrifugal compressor will be less than \$200,000. The closest MCC was inspected during the study and it was determined that it could support the electrical needs of an electric driven compressor. We have been told that an electric driven compressor previously operated in the area before the steam turbine was installed. In the future, the new C5 compressor will be rotated with C6 compressor automatically in order to equalize the operating hours. The airend for C5 compressor should be set aside in a storage area outside of the elements. The airend should be set up for long term storage to include installing desiccant bags as recommended by the OEM. The airend should be turned on a monthly basis to ensure the bullgear is properly lubricated. The ports on the compressors should be covered.
C3 Compressor
The C3 compressor is equipped with a steam-driven turbine that lets down steam to the process. The process uses 100% of the low-pressure steam from the discharge of the compressor’s turbine. The plant has estimated that there are seal losses in the magnitude of 2,000/lbs per hour based on the length of the plume observed. At a steam generation cost of \$5.48/1000lbs, the annual cost associated with the seal losses on the steam turbine is \$92,265.
The compressor’s airend is designed for a discharge pressure of 105 Psig and therefore is the limiting factor which dictates the maximum operating pressure delivered to the system. The compressor has also suffered from high stage and oil temperatures due to fouling. Presently the quality of water is poor which is contributing to the fouling of the coolers. The plant has indicated that the compressor has a tendency to surge in the summer months and therefore it is difficult to operate the machine fully loaded during these periods of time. Since the process requires the let-down steam from this unit, it makes sense to operate this machine in the future. However, the design discharge pressure of the machine and its’ age limit its’ capabilities. Based on the supplied performance curves, this compressor should be able to operate without concern of surging at design inlet conditions of 95ºF since the natural surge is 125 Psig. The installed orifice flow meter installed at the discharge of the compressor indicates the compressor is generating close to 1,200 scfm - within the expected discharge of the machine based on its prevailing operating condition.
In order to improve system pressure stability, we believe this airend should be converted to a higher pressure unit which can reliable produce full flow at 115 Psig to 125 Psig. The compressor is over 40 years old and has reached the end of its life cycle. Operating at a slightly higher pressure in the future will only minimally impact the operating cost of the compressed air system. The greatest energy savings in the compressed air system will be achieved by shutting off air compressors that are not required which compressor automation will address. The stage assemblies in the existing compressor can be upgraded with higher head aeros; however this approach would be costly and the plant will still have an old compressor. We propose pursuing purchasing a new air end that is rated for 1,500 Icfm and a discharge head pressure design of 125 Psig. The shaft horsepower of the compressor will have to be reviewed to make sure it does not exceed the capabilities of the steam turbine in the winter months. In the future, this compressor will be used as a base load machine operating at 100% capacity.
C4 Compressor
C4 compressor is an electric driven compressor with a newly refurbished airend from a 1974 L-frame, 4-stage, centrifugal air compressor. The compressor is equipped with a CMC controller which will enable the future automation system to monitor its health and operating point. There are no recommendations related to modifying this machine at this point. However, it is important to note that this machine has favorable turndown capabilities. Turndown is considered to be the amount of flow the compressor can reduce relative to full load before the machine is forced to vent air to atmosphere (to prevent a throttle surge). Therefore this machine may be effectively used at some point as a part load machine. We do not recommend retrofitting this compressor with inlet guide vanes (IGV’s) at this point but should be assessed at certain intervals.
C6 Compressor
C6 compressor is the machine with the largest discharge capacity in the entire system. The greatest attributes of this compressor are that it is relatively new; it operates on clean cooling water, and most importantly has the greatest turndown capability of any machine in the system. Based on the machine’s throttle limit (TL) setting and its surge indexing value, we estimate that this compressor has turndown capabilities are presently in the range of 700 scfm to 800 scfm at the prevailing discharge pressure. In the future, this compressor will be designated as the primary part load machine due to its generous turndown. However, the compressor is equipped with an inlet butterfly valve (IBV) which creates a restriction at the inlet and is a destruction of energy. An IBV will consume anywhere from 0% (full load) to 4% (throttled to TL set point) more energy compared to an Inlet Guide Vane (IGV). Even more importantly, the stability of an inlet butterfly valve (IBV) is inferior compared to an optional inlet guide vane (IGV) since its flow characteristics are not linear. In order to improve the overall reliability and operating cost of the system, we propose retrofitting C6 compressor with an inlet guide vane. In the future, this compressor will be monitored via Modbus and therefore the operating position of the machine will always be known. If the compressor becomes severely part loaded and starts to vent to atmosphere using the blow off valve, the automation may make a decision to start a smaller compressor and shut off this machine in order to supply to become more aligned with demand.
2. System Storage
Adequate storage for large decentralized systems is critical as it provided pressure stability and stored air for use during the loss of an online air compressor. During the study the capacitance of both the PA and IA systems was measured. Capacitance is considered to be the collective volume of all piping and storage tanks in the system. The IA system has 8,378-gallons (77.6 Scf/Psi) and the PA system contains 10,984 (101.8 Scf/Psi). Collectively the compressed air systems contain 19,362-gallons or 179 Scf per psia. In other words, if you remove 179 scfm out of the system, the pressure in the piping will drop by 1 Psig. This value is needed to predict the system dynamics during the largest event in the system which is the loss of a primary online air compressor. In your case it will be the loss of C6 which is 2,700 scfm rate of flow or 45 Scf per second. With the use of compressor automation, it will take about 60 seconds to detect a failure, start a backup machine and produce full flow to replace the failed unit. We assume that the acceptable temporary pressure drop (relative to the prevailing set point) in the system is 10 Psig. Therefore the system capacitance must be able to supply 2,700 Scf (45 Scf/sec x 60 seconds) during the event to act as a buffer until the backup machine produces full flow.
The system’s storage value must be at least 270 Scf/Psig (270 Scf/Psig x 10 Psig drop) in order to support the largest event in the system allowing a 10 Psig pressure drop. Since the system already contains 179 Scf/Psi, an additional 91 Scf/Psi (about 10,000 gallons rated for 150 Psig minimum) of storage is needed for the system. If the plant cannot withstand a 10 Psig pressure drop during a compressor failure, then the storage will have to be increased according based on the calculations provided above. A single storage receiver makes the most sense as it will be the most cost effective to purchase and install and will have the smallest footprint. The storage tank can be installed anywhere in the system where there is a main distribution header 4” or larger. The tank could also be teed into two (2) 3” lines if a 4” line is not available. The exact location of the new 10K minimum receiver can be determined during the engineering design phase of the project. The receiver tank can be new or used. Due to the size requirements of your system, you may be able to procure a used propane tank for such service. A propane tank can often be cost effective allowing the site to purchase a larger tank than the minimum requirements.
3. Back-flushing Compressor Coolers
The quality of the cooling water affects the performance of the compressor inter and after-coolers which negatively impact their operating surge points. Fouled coolers will also increase the discharge temperature of the air compressors increasing the moisture load on the PA dryers. Each compressor should be piped so that it can be back-flushed in place when the cooling temperature differential (CTD) increases to unacceptable levels. CTD is considered to be the difference between the entering cooling water and discharge air temperature of the heat exchanger. Typical performance for the inter and after-coolers is a 15ºF CTD. For example, the prevailing cooling water supply temperature is 80ºF. The expected discharge air temperature for the exchanger should be close to 95ºF if the cooler is not fouled. C5 and C6 compressor are equipped with a 4-port valve which can be adjusted in order to reverse the flow of cooling water through the air compressor coolers. We proposed retrofitting C2, C3 and C4 with a similar 4-port valve so that they can be back-flushed based on operating temperatures.
4. Compressor Controls
It is difficult to set up multiple compressors to operate efficiently using their own local controls. The complexity becomes even greater when the air compressors are located in different areas. Compressors can be “cascaded” by staggering set points on the individual machines. If a compressor fails in this scenario, the pressure in the system will fall until the next compressor loads or ramps up. Since there is insufficient storage to support the failure of a primary air compressor, the plant typically operates all compressors at a part loaded condition. This approach can be effective but results in a very high cost of operation since waste is created through compressor blow off (venting to atmosphere) and modulation of inlet valves.
An efficient compressor supply should be designed to operate all on line compressors, if possible, base loaded at 100% capacity and operating at the lowest acceptable discharge pressure. Operating a centrifugal compressor fully loaded at 100% capacity is desirable since it is the most efficient operating point that delivers the maximum scfm per kilowatt hour of electricity and is the furthest operating point from the surge line. Typically it is not possible to operate all compressors fully loaded since demand will vary during the course of a day. An effective control scheme will limit the number of part-load compressors to a single unit in most instances. Large decentralized compressor systems are difficult to optimize using the local compressor controls or with only partial automation. Compressor automation that coordinates the sequencing of the air compressors is the most effective way to maintain peak efficiency on the supply side of the system when cost effective. In your case it is imperative that automation can monitor the exact operating position (percent loaded, amps, etc) in order to determine the most appropriate mix of online compressors.
We propose installing an automation system that can automatically start and stop the five (5) primary air compressors in the system. The compressors will operate using operating pressure pressure points located at the discharge of each compressor room. The automation will have the ability to monitor the condition (on, off, and percent loaded) of each unit. In the event an on line compressor fails, the automation will detect a negative system rate of pressure change simultaneously with a signal that there is a loss of power at one of the air compressors (by monitoring amperage for the electric driven compressors and auxiliary contacts for the steam driven units). The automation will pre-emptively load the next available air compressor before the pressure decays to a level unacceptable to production. The automation will be programmed with the knowledge of the capacitance value of the system (total volume of tanks and piping in the system) in order to determine the rate of change (ROC) or the difference between compressor supply generated and actual demand. Once the next compressor is added to the system, the automation must be able to wait and determine if the pressure recovers in an acceptable period of time. One of the keys is to be able to tune the logic so that it does not under or over-react to system transients.
After all action plan items have been completed, the system will be able to operate on two (2) air compressors. We propose running C3 fully loaded at 100% capacity in the Utilities area with C2 and C4 in automatic backup. Either C5 or C6 will act as the incremental trim machine for the system. Since C6 has the largest turndown, it will be the most efficient machine to operate. A PLC based processor will be installed in each compressor room to manage the air compressors. The processors will communicate with each other by either communication wiring, wireless, or using a fiber optic backbone. The new compressor automation logic should be provided by a group that strictly deals in compressor automation to ensure there is complete knowledge of the capabilities and shortcomings on each piece of equipment.
5. Conclusion
Keeping an open mind is critical in all system assessments. Each client has different priorities and circumstances. In this case, the elimination of the “close-scrapes” with insufficient pressure was the priority. The energy and rental/maintenance savings realized were just an added bonus. In this article, we have focused on the supply-side of the system and how the centrifugal compressors could be made to supply the system reliably – without the need for rental air compressors. In Part 2, we will focus on the demand-side of the system and the actions realized to reduce compressed air demand.
Contact Paul Edwards; tel: 704-376-2600, [email protected], www.loweraircost.com.
To read more System Assessment articles, please click here.
To read Part 2 of this article please click here.