Bottling companies and breweries, in California, are benefiting from a three-step system assessment process aimed at reducing the electrical consumption of their compressed air systems. The three-step process reduces compressed air demand in bottling lines by focusing on open blowing and idle equipment, and then improves the specic power (reducing the energy consumption) of the air compressors.
Step #1: Replace Compressed Air in Open-Blowing Applications
The Situation
Bottling companies require 2-3 PSI “open-blowing air” for many applications including, but not limited to, bottle drying for sleeve, paper or pressure sensitive labeling, crown and safety seal drying, warmer and pasteurizer discharge blow-off, combiner gap prevention, ionized air rinsing, drying prior to ink jet coding and shrink or cardboard packing of: cans, jars, PET and glass bottles, kegs & barrels, crates & pallets, boxed drinks, and pouches. Due to convenience of installation, many bottling facilities use compressed air, even though it’s produced expensively at 50 times the required pressure (typically 100 psi), for these low-pressure open-blowing applications.
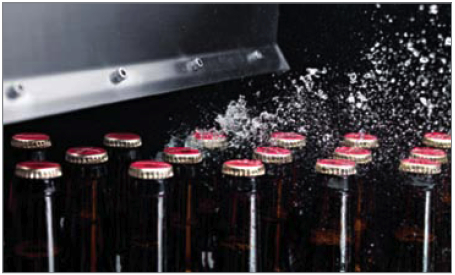
Beverage Drying: For line speeds from 12,000-72,000 bottles per hour (Bph), custom-designed centrifugal blowers and air knives guarantee no moisture related problems with sleeve, paper or pressure sensitive labeling; crown and safety seal drying; pasteurizer discharge blow-off; post-steam shrinking, twist push-through; combiner gap prevention; ionized air rinsing; stress corrosion; hygiene blow-off; ink jet coding; and shrink or cardboard packing of: cans, jars, PET and glass bottles, kegs & barrels, crates & pallets, boxed drinks, and pouches. Photo provided courtesy of JetAir™ Technologies. |
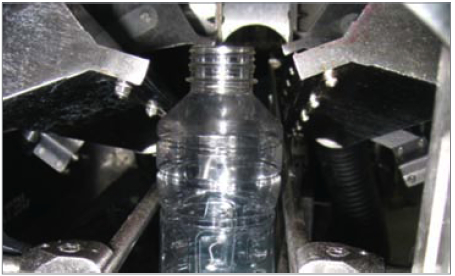
A system assessment, at a soft drink bottler, identied the use of compressed air in a gap transfer on their canning line as a source of energy inefciency. The compressed air was directed through two 1/4" copper tube nozzles to transfer empty, open aluminum cans from a single cable-pulley system to a second cable-pulley system over an unassisted gap of approximately 18-20 inches. The purpose of the gap was to provide access for the inkjet date imprinting which is visible on the bottom of the cans. The compressed air application, although an inefcient use of compressed air, enabled the continual ow of the cans across the inkjet printer to the second cable-pulley system. A second concern was the high noise level caused by the nozzles at the transfer.
Although only needing 2-3 PSI of pressure at the site of the gap transfer, 100 PSI compressed air was used — a full 50 times higher than the required pressure. The air flow measured at each of the two nozzles was 50 CFM. Assuming the industry “rule-of thumb” of 4 CFM per kW, the application was requiring 22.7 hp (18kW) of energy generation. With an operating schedule of 3000 hours per year, total energy usage was estimated at 53,430 kWh costing \$4,530 a year.
The Solution
The solution was a high-speed motor, centrifugal blower, Variable Frequency Drive (VFD), and four custom adjustable-mount nozzles. The centrifugal blowers direct-drive technology enabled adjustable operation speeds of up to 20,000 RPM, creating adjustable flow rates of up to 750 CFM at pressures of 2.3 PSI. The compact footprint of the motor and blower enabled it to be located within feet of the application via 3" diameter (75 mm) hoses to the adjustable nozzles. The nozzles were then mounted at each corner of the guide rails (bottom/top-left, bottom-top-right) at the beginning of the gap. The custom mounting application and nozzles provided the soft drink bottling manufacturer adjustable air directional ow, while the VFD provided air flow and pressure adjustability.
The custom blower solution consumed only 3 Hp (2.2 kW) representing an energy reduction of 20 HP, or an 87% true energy consumption savings. Based upon the soft drink manufacturer’s production cycle and kWh rate, annual energy costs were estimated at only \$970 per year resulting in a total annual savings of \$3,560. This drastically reduced the soft drink bottling manufacturer’s annual energy costs by 80%. These energy cost savings offered an estimated 65% return on the investment in the rst year, and 125% ROI in two years. As an added bonus, the new blower system eliminated the high-pitched operational noise emitted by the old gap transfer system.
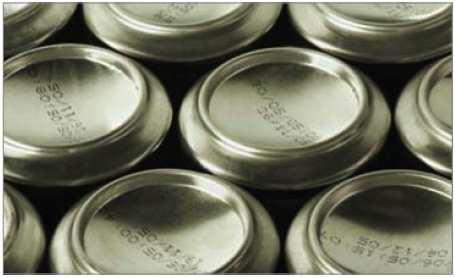
Can Printing: Printing on wet cans results in illegible lot/date codes and “can bursts” ruining packaging and unsellable pallets of product. Centrifugal blowers and air knives replace compressed and improve drying performance. Photo provided courtesy of JetAir™ Technologies. |
Step #2 – Stop Idle Equipment from Using Compressed Air
The Situation
System assessments consistently discover that idle production equipment, in bottling lines, needlessly consume compressed air. At a California bottling company, a test was performed when no bottling lines were operating or in other words — no product was being made. During the test, the compressed air ow was 935 scfm, of which 700 scfm was from idle production equipment. From 0200 to 0600, and during normal plant operation of one of four bottling lines, 525 cfm of wasted compressed air was consumed. This wasted compressed air was the equivalent to 125 hp worth of energy-consuming air compressors running any time three of the four lines were not in operation.
In order to estimate the total amount of compressed air wasted each year at this facility, conservative figures were used to calculate the total amount of hours where production lines were not in use. It was assumed that each production line is down for a total of one hour during the daily hours of 0600 to 0200. During the early-dawn hours of 0200 to 0600 it was estimated that one production line was operating and three were down. The savings potential was estimated at 166,317 kWh or \$20,000 per year.
The Solution
Stopping the supply of compressed air to the idled bottling equipment reduced the consumption of compressed air. To do this, air shut-off valves were installed before each piece of production equipment to ensure that the machine would not use compressed air when idle. A simple and cost-effective solution.
The electrically-operated (normally closed) air shut-off valves were wired into the on/off switch of each piece of bottling equipment. If the equipment had a separate run switch, wiring the normally closed air shut-off valve into the run circuit had the added advantage of shutting off the compressed air during breaks and lunches. A second discovery from the system assessment was that all parts of the bottling process did not need air simultaneously. Solenoid valves were used to shut off the air supply when not required. Implementation costs were \$10,000 providing a simple ROI of 6 months.
Water Container Drying: A facility filling 5-gallon water containers replaced compressed air with a direct-drive centrifugal blower. Photo provided courtesy of JetAir™ Technologies. |
Step #3 – Optimizing the Specific Power (kW per 100 cfm) of the Air Compressors
The Situation
Once a system analysis has investigated all the ways to reduce compressed air demand and pressure in the facility, the system assessment turns it's attention to making sure that the air compressors are operating in the most efcient manner possible. The idea is to get the maximum volume of air flow (measured in cfm) for every kW consumed of power. This is called optimizing the specific power of the air compressors.
A system assessment, at a bottling facility in Southern California, revealed that the existing compressed air system did not optimally match compressor output to system demand. In multiple compressor installations, without automation, there is a high likelihood that the compressors will be partially loaded.
The problem with this is that none of the compressors will operate at their maximum efciency levels. It is always more efcient to operate one air compressor at full load versus operating two or three air compressors at partial load. The CFM/kW value for this system was 23 kW per 100 CFM. Well-designed systems can be expected to have an average specic power lower than 18 kW per 100 CFM.
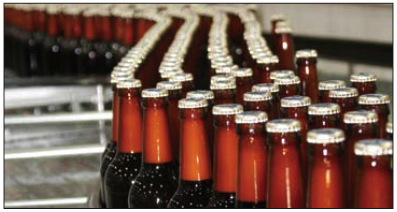
Labeling at Breweries and Micro-Breweries: When labels go askew, the major reason is a wet bottle. Water is an essential element of beer, but it creates a slippery surface on containers as they travel — often at speeds of 2,000 bottles a minute — into the packaging process. At 14,000 to 20,000 rpm, centrifugal blowers instantly strip water off, making labels adhere even in harsh conditions, like high humidity. Photo provided courtesy of JetAir™ Technologies. |
A pressure drop from the air compressor’s discharge to the plant was the result of ltration, inadequate pipe sizing and an additional, unnecessary air dryer installed. Piping velocities exceeded 51 feet-per-second (fps) at peak production, well above recommended guidelines. The higher the velocity, the greater the pressure drop, increasing energy costs. One of the 100 hp air compressors operates at least 3 to 4 psig higher than the other air compressors and runs partially loaded due to the unnecessary air dryer dedicated to this air compressor.
The storage capacity of the compressed air system was estimated to be 145 cf/bar or 10 cf/psig. This capacity was in multiple small air receivers totaling 760 gallons, over 500 feet of 3" pipe and over 900 feet of 2" pipe. This means that if the plant were to lose a 100 hp air compressor and assuming it was fully loaded, the plant pressure would drop 24 psig in less than 30 seconds.
The annual energy costs of this system, operating at a specic power of 23 kW per 100 CFM, was \$183,187 consuming 1,813,729 kWh.
The Solution
A two-stage variable speed driven (VFD) air compressor was installed. This air compressor replaced an existing 100 hp air compressor and automatically adjusts its speed, thus matching compressor output to system demand. It was rated to produce a minimum of 675 ACFM at 100 psig at less than 118 kW or better than 18.0 kW/100 ACFM. The new air compressor can turn-down efciently to less than 120 ACFM at less than 26 kW. At minimum speed, the new air compressor can stop and then immediately load if required.
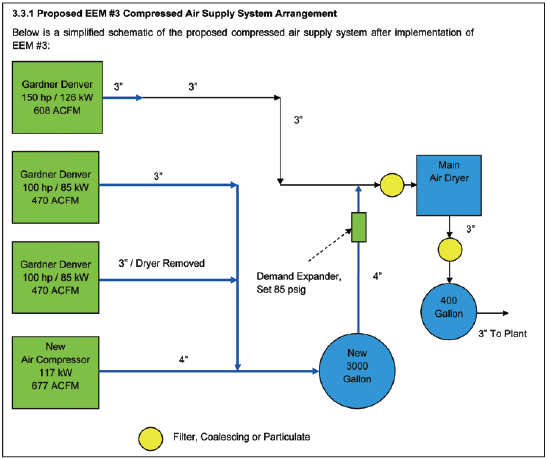
The compressor room piping header and primary branch headers were sized so that the air velocity within the header did not exceed 20 ft/sec to minimize pressure drop and allow for future expansion. Distribution branch lines were sized so that the air velocity within the header did not exceed 30 ft/sec. The undersized 2" discharge pipe on one 100 hp air compressor was replaced and the redundant air dryer was removed eliminating unnecessary pressure drop. This pipe was tied into a new 4" pipe from the new air compressor to a new 3,000 gallon air receiver. A new 2,000 CFM pressure flow controller/demand expander was installed after the new air receiver. The new demand expander was set at 85 psig and maintains plus or minus 1 psig with a full PID digital control loop connected to a dedicated control. The existing 1,000 SCFM main air dryer supported the reduced plant load (after a blower retrofit) at the lower pressure with average airflows calculated to be less than 575 ACFM.
Specific power was improved by 6 kW (per 100 ACFM of air flow) with the new compressed air system design. Annual energy savings were \$80,586 with a simple ROI of 1.8 years and only 1 year with the energy incentive. |
The air compressors were set up so that the new VFD air compressor supported the plant demand most of the time. When the demand exceeds the capacity of the new VFD air compressor, one of the existing 100 hp air compressor starts and runs 100% loaded. The VFD responds by slowing down and operating efciently at part load. This was accomplished by setting the VFD target point to 100 psig with an unload point of 110 psig. One of the 100 hp air compressors was set to operate load/no-load and load at 95 psig and unload at 105 psig with no modulation. The resulting specific power was less than 17 kW per 100 ACFM — an improvement of 6 kW per 100 ACFM.
The new annual energy costs of the compressed air system, operating at a specic power of 17 kW per 100 ACFM, were \$102,601 consuming 1,015,858
kWh. The resulting energy savings were \$80,586 with a simple ROI of 1.8 years and only 1 year with the energy incentive.
Contact Kyle Harris or Creg Fenwick at tel: 661-619-2470 or email: [email protected]. www.accurateair.com
For more System Assessment articles like this, click here
January 2012