A Canadian facility saves significant energy by reducing system pressure and inappropriate uses
A comprehensive compressed air assessment was conducted at a Canadian plywood facility. The purpose was to determine the proper size of any new air compressors and to look for ways to improve the system. Analysis of the data and a demand-side audit finds significant energy savings could be gained if the system is upgraded through air compressor replacements and demand-side reductions.
Far from Optimal Specific Power
The study used cellular connected data loggers to measure and track air compressor power (calculated from amps), discharge and plant pressure, compressed air dew point and compressed air flow for a period of four weeks. The instruments showed the system ran at poor efficiency (specific power of 27.7 kW/100 cfm), not including compressed air dryer power, during this period. Optimal specific power for systems of this size running at 100 psi (7 bar) would be about 19 kW/100 cfm, including an optimized compressed air dryer.
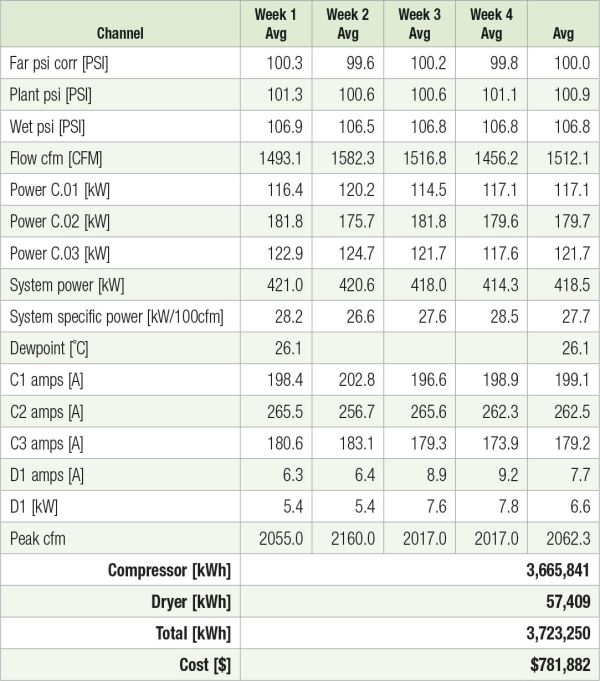
Table 1: Data logging concluded the system was inefficient and the compressed air dryer had failed, causing poor air quality.
The system consists of three independently controlled air-cooled lubricated screw air compressors – two at 200-horsepower (hp) and one 150-hp – with total rated output estimated at 2,870 cfm. The air compressors operate quite inefficiently due to internal control problems and aging conditions. The air is filtered and dried using a heated blower desiccant dryer. The dryer heater control circuit has failed resulting in wet air entering the plant even though the dryer blower continues to operate. A thorough inspection of plant piping could find no reason to operate a desiccant dryer for this plant.
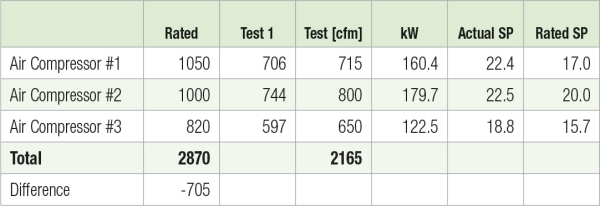
Table 2: Initial data logging and flow measurement pointed to reduced capacity, and a physical flow test confirmed this.
Total effective system volume, including piping, is estimated at about 2,800 gallons, a small volume for a system of this size. Optimal would be to have 4,000 gallons or larger (about four gallons per cfm times the 1,000 cfm rated flow of the largest air compressor). There was no wet storage tank before the compressed air dryer, just a large dry storage tank. The main plant piping backbone is well sized using six-inch and four-inch piping with little pressure loss across the system, confirmed by placing data loggers at the far end of the system. Most of the system pressure loss – 5.8 psi (0.4 bar) average – is due to the compressed air dryer and filters.
Control coordination uses a poorly configured manual cascade strategy, which leads to less than desirable efficiency. One 150-hp air compressor runs in modulation mode, which is the least efficient way to run an air compressor. The two other air compressors seem to produce air with poor efficiency, likely due to inlet valve problems and internal wear on the screws. The product in this plant uses a compound to bond the layers of plywood together. The glue mixing area is adjacent to the air compressor room. When the compound is removed from shipping bags, the ambient air is contaminated with dust from the bags, which is then ingested into the air compressors. This compound clogs the operation of the poppet-style inlet valves, preventing them from operating properly.
Constantly High Pressure
Another issue is higher than desired operating pressure (Figure 1) that exceeds the 100-hp pressure rating of the two 200-hp air compressors, making the air compressors consume greater than required power and sometimes leading to overcurrent trips.
The use of timer-style condensate drains on receivers, compressed air dryers and filters wastes compressed air. A better choice would be high efficiency airless drains. The condensate from these drains is directed outdoors where it contaminates the soil outside the air compressor room, causing an environmental problem.
The lowest desired plant pressure is assumed to be about 90 psi (6.2 bar) based on interviews with maintenance staff, yet the system is set at 106 psi (7.3 bar) to compensate for pressure loss across compressed air dryer and filters and to compensate for the drop caused by the poorly set cascaded control mode.
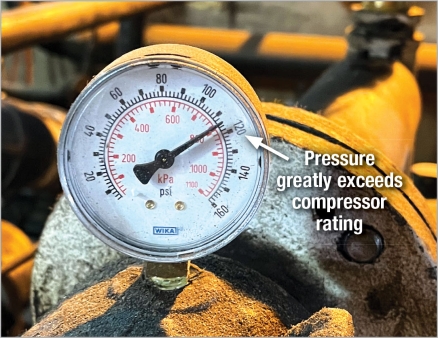
Figure 1: The pipes connecting this 200-hp air compressor to the remote cooler installed on the air compressor room wall were only two-inch size, causing a large pressure loss. Because the air compressor is only rated at 100 psi (7 bar), the dive motor would trip.
At current peak load there is not enough air compressor capacity to withstand the loss of any air compressor and still maintain full plant pressure (Figure 2). Either the purchase of additional capacity should be considered or the reduction of demand-side waste. The best place for new capacity would be in a new air compressor room away from the chemical mixing area that causes air compressor issues due to air compressors ingesting chemical dust.
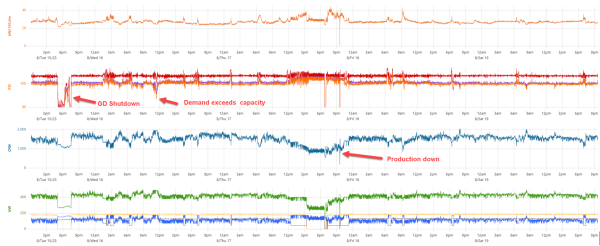
Figure 2: Demand exceeds supply causing low pressure dips. Use of larger storage and higher capacity air compressors would eliminate this problem. Click to enlarge.
The difference between the actual system specific power compared to the ideal (27.7 vs 19 kW/100 cfm) suggests significant levels of air compressor energy savings are possible (about 25 to 30%) if air compressor control inefficiency, drainage waste and discharge pressures are reduced. Figure 3 shows the difference between actual and optimal levels.
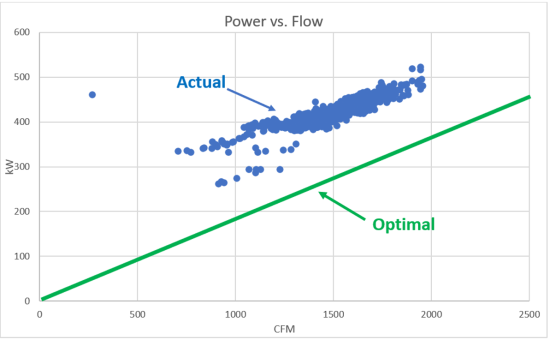
Figure 3: The flow vs. power characteristics of this system were less than optimal due to higher discharge pressure and poor air compressor operating efficiency.
The study found the compressed air system consumed an estimated 3,723,000 kWh through 8,760 hours of operation, while producing about 1,510 average cfm of compressed air, costing about \$782,000 in annual charges. The power cost for this plant is \$0.21 cents per kWh – much higher than similar plants in other areas. (All monetary figures in this article are in Canadian dollars.)
A leakage and end-use survey done with an ultrasonic detector found total leaks estimated at 200 cfm. The plant has an ultrasonic detector, but it isn’t used regularly. Quarterly use of this detector is recommended to keep leakage waste in check.
A Variety of Inappropriate Uses
On the demand side, significant inappropriate use and waste was found. If repaired, this could result in significant energy savings and free up air compressor capacity. Achieving these savings requires significant work and persuasion of plant personnel. Some items found to contribute to wasted flow include:
- Compressed air-powered vortex electrical enclosure coolers. A few PLC panels have compressed air-powered electrical enclosure coolers installed to cool the internal electronics. These coolers are uncontrolled and operate even when the PLC panel is off and temperatures are normal. About 25 cfm of compressed air is used for these applications. Refrigerative cooling consumes 20 to 30 times less power for the same result.
- Cooling clutches above the press. Four clutches control the raising and lowering of the press beds where plywood is formed. Bearings attached to the clutches sometimes get hot, so air nozzles were placed to cool them. This demand was measured at 140 cfm. One blowing nozzle wasn’t even directed at the clutch (Figure 4). Cooling bearings with clutches can cause mechanical problems because this cools only one side of the bearing, causing deformities and alignment issues. The plant is advised to consider fans or blowers if cooling is needed.
- Diaphragm pumps. Some air-operated diaphragm pumps were running continuously, even when not required, consuming 100 cfm continuously. New versions of pumps have electronic optimization to reduce air use. Electric diaphragm pumps are now available that can result in 80 to 90% electrical savings.
- Blowing wands in ducts to clear sawdust. Blow wands have been stuck in sawdust pick up ducting to prevent clogging in two locations (Figure 5). These are controlled by the machine operator through partially cracked open ball valves, so the flow varies considerably. It was measured at 200 cfm during the plant inspection.
- Dry ice blasting. The layers of wood used in the assembly of plywood pass through a kiln to dry. These kilns must be cleaned of flammable residue weekly. Dry ice blasting is used and consumes significant peak air flow, causing low pressure events that impact production. The plant should either consider adding a separate compressed air system or protect the existing system from high flows by using a large storage tank to isolate this demand from the main plant system.
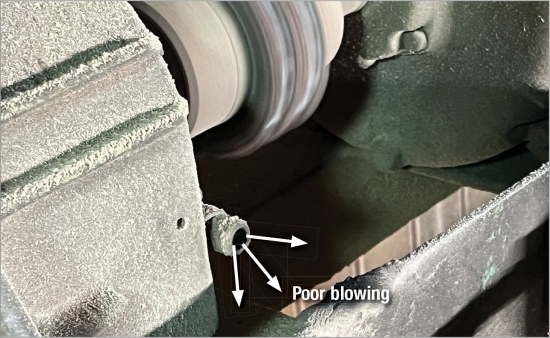
Figure 4: Clutch bearing blowing was implemented, yet the nozzle on one was not blowing on anything. It is likely this blowing can be removed for a substantial savings.
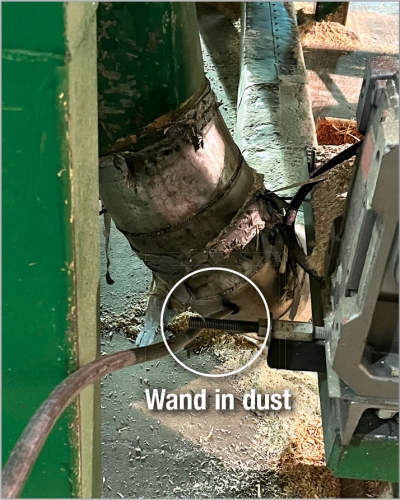
Figure 5: A blow wand stuck in a sawdust recovery duct blows constantly, even during production downtime. This application could be eliminated with proper ducting.
By adopting a more efficient air compressor control (using new or rebuilt air compressors, including one with a VSD), lowering discharge pressure, adding a cycling refrigerated dryer, reducing leaks and eliminating inappropriate uses could lead to energy savings of up to \$435,000 (56%).
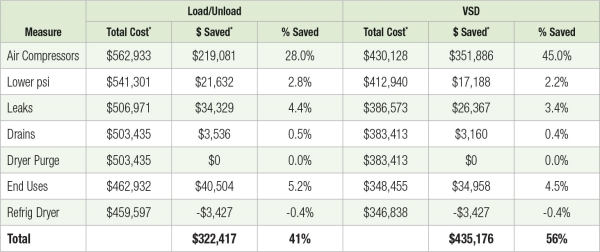
Table 3: A summary of potential savings opportunities if aggressive measures are implemented. Use of a VSD air compressor would save the most.
About the Author
Ron Marshall is a seasoned compressed air expert and the Chief Auditor at Marshall Compressed Air Consulting. With extensive experience conducting air system assessments, Marshall specializes in optimizing air compressor efficiency and reducing energy consumption. He is a Certified Engineering Technologist (C.E.T.), Certified Industrial Manager (C.I.M.) and Certified Compressed Air System Specialist contributing valuable insights through his training sessions and writings on compressed air topics. His expertise and practical solutions have made him a trusted authority in the field of industrial compressed air systems.
To read articles on Compressed Air System Assessments, visit https://www.airbestpractices.com/system-assessments.
For expert presentations, visit our Webinar Archive Section dedicated to Compressed Air Measurement at https://www.airbestpractices.com/webinars.