Created by the Oak Ridge National Laboratory and the DOE, the tool provides a simple way to measure and improve compressed air system performance

Oak Ridge National Laboratory in Oak Ridge, TN (Image courtesy of ORNL/U.S. Department of Energy).
Standards and practices around compressed air systems are evolving as previous golden rules become outdated and unhelpful. One of the most referenced guidelines gives us the perfect example: The previous rule of thumb for compressed air storage – 1-3 gal/cfm [1] [2] – is now accepted to be 3-5 gal/cfm. This change in recommended storage is only one of many in the industry, resulting in industrial users lost in a sea of contradictory best practices.
To help combat confusion and poor information sharing, a collaborative effort between Oak Ridge National Laboratory (ORNL) and the Department of Energy’s (DOE’s) Better Plants program created the Compressed Air (CA) Scoping Tool with the most up-to-date best practices in the industry (as of 2023). It can be used as a nonbiased, one-stop shop for best practice recommendations. The Excel-based tool is designed to be an initial step in understanding the operation of a compressed air system, a baselining tool enabling users to comprehend various aspects of a facility’s system from the production of compressed air to its application by end users.
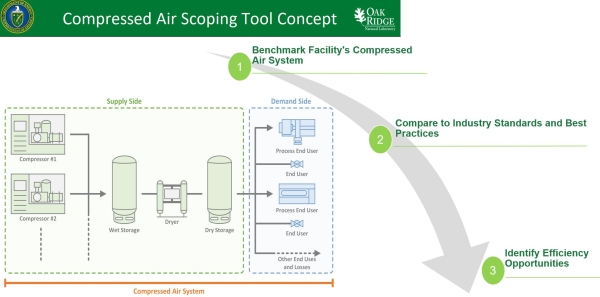
The CA Scoping Tool provides a simple way to benchmark compressed air systems and learn from the most current best practices. Click to enlarge.
Overview of the CA Scoping Tool
The CA Scoping Tool should be seen as a first step in analyzing and understanding a compressed air system. It does not replace an assessment, but should be used as a learning, training and benchmarking tool. After completing the questions, users will gain a better understanding of their compressed air systems and get recommendations to save energy and money. The tool is designed to identify areas in need of improvement, but can also be used to identify best practices. Results can be used to brainstorm improvements or indicate when an outside expert should be consulted. After the analysis is complete and the system is improved, the user is encouraged to revisit the tool to conduct a comparison to their baseline and continue the improvement cycle.
In the Excel-based CA Scoping Tool, users are asked questions about their operational practices. They select responses from drop-down menus, ranging from yes/no options to time ranges or frequencies. Each question receives a score based on the provided answer, contributing to the overall system evaluation. Some of the questions include multiple options, with higher scores assigned to answers representing better operational practices. At the end, scores are gathered and a report card with recommendations is generated. Hence, the CA Scoping Tool serves as the initial step for industrial manufacturing plants to benchmark and enhance their compressed air systems.
As shown in Table 1, the tool consists of nine tabs, six of which are part of the graded portion. The table displays the types of data collected, the corresponding results and the identified energy-savings opportunities.
Table 1. CA Scoping Tool organization
| 1. Instructions | Instructions on how to fill out the data collection sheets |
| 2. Plant Information | Equipment description |
| Resource consumption (air compressor inputs) | |
| Facility set points (air compressor outputs) | |
| Production uses | |
| Annual costs | |
| 3. System Profiler | Compressed air system measurements |
| Compressed air system cost analysis | |
| Compressed air intensity | |
| Heat recovery | |
| 4. Compressed Air System Operating Practices | Air leak management |
| Pressure control | |
| Maintaining effective compressed air system operations | |
| 5. Air Compressor Operating Practices | Air compressor efficiency |
| Air compressor performance | |
| 6. Compressed Air Quality ISO 8573.1 | Particulate content |
| Moisture content | |
| Oil content | |
| 7. Compressed Air System Operating Practices: Distribution, End Use, Recovery | Inappropriate uses |
| Artificial demand | |
| 8. Results | The final scores for each section |
| 9. Energy Saving Opportunities | Possible recommendations based on the user’s inputs |
The tool breaks down the scoping process into three distinct steps: benchmarking the current compressed air system, comparing operating procedures against current best practices and identifying energy efficiency opportunities based on user responses.
Compare a Facility with Industry Standards and Best Practices
After some fundamental benchmarking questions, the second step in the CA Scoping Tool compares the facility’s operational characteristics with industry-accepted standards and best practices. These 97 questions comprise best practices widely accepted in academia and the compressed air auditing industry, and have been reviewed by members of both communities. The questions range from rules of thumb to International Organization for Standardization (ISO) standards for compressed air systems. The questions cover supply side, demand side and system-wide topics.
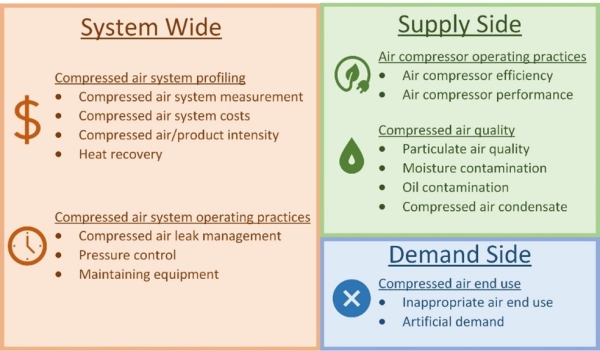
Groupings of question areas within the CA Scoping Tool.
Results and Identified Efficiency Opportunities
After completing the questionnaire, the user is provided the scores from the comparison step. This area of the tool summarizes scores for each topic. The user then receives their report card and a comprehensive list of possible energy-savings opportunities based on their scores. These opportunities are directly linked to the answers given in the comparison steps of the tool, and should be seen as entry points to start investigating recommendations for the facility.
Partner Plant Case Study
As part of the testing of the CA Scoping Tool, a Better Plants partner was asked to review and use the tool. The partner used the tool at one of its sites and received a list of recommendations to improve its compressed air system. The following sections provide an overview of its experience and use of the tool.
Partner Plant Information
The partner had four air compressors: two 400-horsepower (hp), one 300-hp and one 100-hp. Through discussions with plant personnel, the partner discovered the operating times for each compressor differed slightly and none of them ran 24/7 (this was discovered through the benchmarking exercise). Finally, using the nameplate values, the partner defined the total potential air flow for the air compressors. A summary of the air compressors is shown in Table 2. The pie chart reflects the proportional rated flows for the air compressors in the system.
Table 2. Summary of the plant’s compressed air system
| Air Compressor Name | Rated Power (hp) | Annual Operating Hours (Hrs/year) | Rated Flow Capacity (acfm) |
| Compressor A | 400 | 6,000 | 1,771 |
| Compressor B | 300 | 3,744 | 1,350 |
| Compressor C | 400 | 8,400 | 1,750 |
| Compressor D | 100 | 6,000 | 460 |
| System Total | 1,200 |
— |
5,331 |
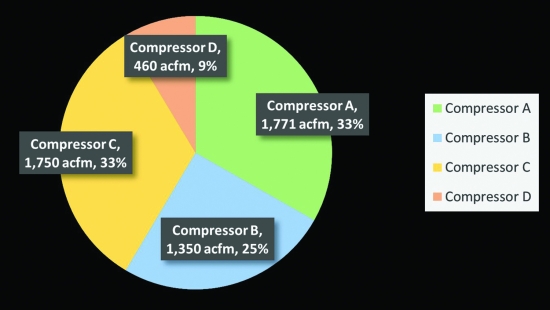
Summary of air flow capacity by air compressor.
The partner reported an annual electric consumption of 4,454,218 kWh/year to operate the compressed air system, with no cooling water consumed and no compressed air purchased off-site. After reviewing compressed air production data, the partner reported an average compressed air production of 1,720 acfm during production hours, with a peak compressed air demand of 2,315 acfm and a pressure set point of 104 psig (7 barg). Based on results from the plant information tab using a marginal cost of $0.04/kWh, the facility found the estimated cost of the compressed air system was $338,168/year, roughly equivalent to $0.343/100 cubic feet of compressed air.
Results from the Partner Plant Questionnaire
After completing the questionnaire, the partner received an overall score of 47% (scoring 529 of the available 1,126 points). The final tally for each section indicated room for improvement across the entire system, with the lowest score in the compressed air system profiling section. The results showed the strongest part of its system is its end users. Table 3 and the bar chart reflect the partner’s score for each section. The partner intends to reassess its compressed air system after improvements are made. The partner would also like to compare similar facilities to gather and replicate best practices within its own company.
Table 3. Summary of the partner plant’s overall score
| Possible | Plant Score |
% |
|
| Score | |||
| Compressed air system profiling | 268 | 102 | 38.10% |
| Air compressor operating practices | 253 | 108 | 42.70% |
| Compressed air system operating practices | 165 | 73 | 44.20% |
| Compressed air quality | 295 | 138 | 46.80% |
| Compressed air end-use practices | 145 | 108 | 74.50% |
| Total scoping tool questionnaire score | 1,126 | 529 | 47.00% |
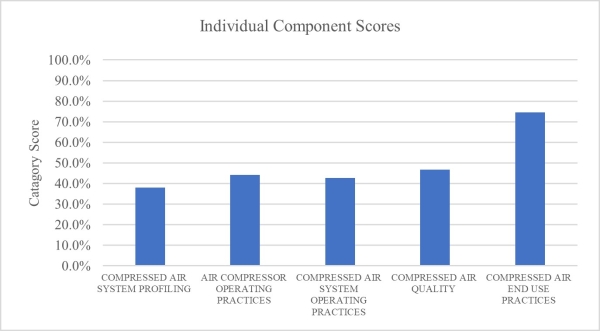
Individual component scores for the test system.
Partner Plant Energy-Saving Opportunities
Based on the partner’s answers, the CA Scoping Tool curated a list of 44 possible recommendations that should be investigated. A full list of the partner’s recommendations can be found in the corresponding journal article or the example data file that comes with the tool [3]. For its lowest-scoring section, “Compressed air system profiling,” the energy-saving opportunities are as follows:
Compressed Air System Costs
1-5. Increase the frequency of the following tasks:
- The volume of compressed air is calculated and reviewed.
- The electricity cost for the air compressors and compressed air dryers is calculated and reviewed.
- Maintenance costs (parts, labor, outside services) for the compressed air system are tracked and reviewed.
- Capital costs and the depreciated value of the compressed air system are tracked and reviewed.
- The fully loaded cost to generate compressed air is calculated and reviewed.
6. Use the fully loaded cost data to determine where to make improvements to the compressed air system.
Compressed Air/Product Intensity
1. Increase the frequency in which the air intensity (compressed air divided by product volume) is measured and trended in terms of cubic feet of compressed air needed per unit of product produced.
Heat Recovery
1. Recover heat for room conditioning.
2. Recover heat for hot process water.
Compressed Air System Measurements
1. Improve data measuring, recording and trending for critical compressed air system parameters.
2. Improve metering for supply-side compressed air flows.
3. Increase metering for demand-side compressed air flows.
Ultimately, the CA Scoping Tool will become part of DOE’s MEASUR tool suite after additional testing and review [4]. The beta version of the tool and sample data can be found on the DOE’s Industrial Efficiency & Decarbonization Office’s resources website for the CA Scoping Tool. [5]
[1] National Renewable Energy Lab., Improving Compressed Air System Performance - A Sourcebook for Indusry, Third ed., Golden, CO, 2016.
[2] R. Marshall, “Optimize Compressed Air Storage to Drive System-Wide Energy Efficiency,” Plant Services, March 2015. [Online].
[3] Botts, A., Marshall, L., Moskowitz, F., Nimbalkar, S. and Wenning, T., 2024. Identifying Energy Inefficiencies in Compressed Air Systems: A Systematic Approach with the Compressed Air Scoping Tool. International Journal of Energy Management, 6(2).
[4] G. Accawi, et al. 2022. “MEASUR - Manufacturing Energy Assessment Software for Utility Reduction.” DOE Office of Energy Efficiency and Renewable Energy, Energy Efficiency Office, Advanced Manufacturing Office.
[5] Industrial Efficiency and Decarbonization Office, “Compressed Air Scoping Tool—Excel, Beta Version (CA Scoping Tool Beta v1.0),” n.d. [Online]. Available: https://www.energy.gov/eere/iedo/compressed-air-scoping-tool-excel-beta-version-ca-scoping-tool-beta-v10.

Alex Botts.
About the Author
Alex Botts is an R&D Associate at Oak Ridge National Laboratory, serving as a Technical Account Manager for the DOE’s Better Plants Program. She supports industry partners with data analysis, Energy Treasure Hunts and software, guiding them to achieve significant energy savings and developing training programs. Her contributions include incorporating the legacy software AirMaster+ into the DOE’s MEASUR software and producing various technical publications, all aimed at advancing energy efficiency and decarbonization in manufacturing.
About the Better Plants Program
The Better Plants Program works with leading U.S. manufacturers and wastewater treatment agencies to set ambitious energy, water, waste and carbon reduction goals. By partnering with industry, the Better Plants program aims to help leading manufacturers boost efficiency, increase resilience, strengthen economic competitiveness and reduce their carbon footprint. Visit https://betterbuildingssolutioncenter.energy.gov/better-plants.
To read similar articles on Air Compressor Energy Management Standards, please visit
https://www.airbestpractices.com/standards/energy-management.
Visit our Webinar Archives to listen to expert presentations on Air Compressor Technology at https://www.airbestpractices.com/webinars.