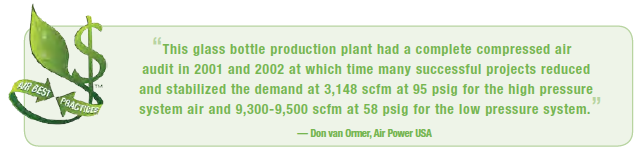
This glass bottle production plant had a complete compressed air audit in 2001 and 2002 at which time many successful projects reduced and stabilized the demand at 3,148 scfm at 95 psig for the high pressure system air and 9,300-9,500 scfm at 58 psig for the low pressure system. Successful application of an oversized 7,200-scfm rated cycling refrigerated dryer completely dried up the high-pressure air, allowing the removal of several non-performing desiccant dryers and savings in direct kW and purge air.
Since that time, the plant has undergone many growth changes and expanded production and subsequently its air usage. The primary changes to the plant production side include:
- EP (Electric Precipitator) system has its own separate air supply and dryers
- Ten more sections have been added to the IS units
- Two additional lines (from 9 to 11)
- One additional Unitizer (palletizer)
Two of the less power efficient compressors were removed from service and a more efficient TA48 was brought in from another plant. This compressor also discharges to a 5,000-scfm rated non-cycling refrigerated dryer.
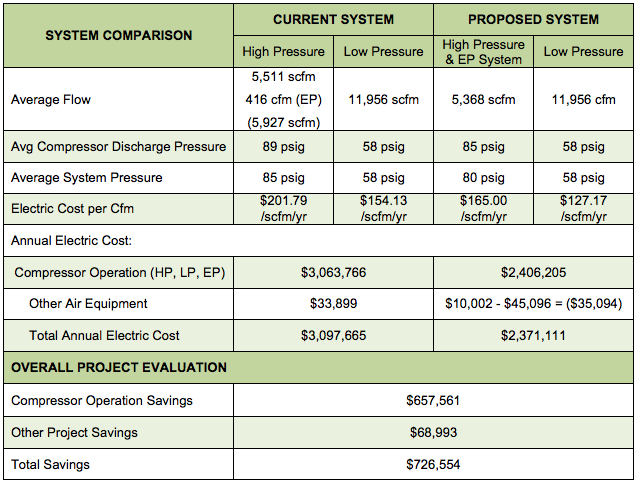
Annual plant electric costs for air production, as running today, are \$3,063,766 per year. If the electric costs of \$33,899 associated with operating ancillary equipment such as refrigerated dryers are included, then the total electric costs for operating the air system are \$3,097,665 per year. These estimates are based on a blended electric rate of \$0.11 /kWh. The air system operates 8,760 hours a year. The load profile or air demand of this system is relatively stable during all shifts.
The Existing Compressed Air System
Low Pressure: The low-pressure system has four centrifugal air compressors. All four are normally in operation providing an average total of 11,956 scfm of compressed air flow at 58 psig.
Unit #5 and Unit #2 both appear to be running at full load in a normal manner with the exception of Unit #2, which had the inlet valve at 81% open in the cooler morning air and up to 74% open during hotter afternoons. The amperage stayed at a constant 132 amps, which is obviously the minimum amp limiter.
Units #6 and #7 are both in full turndown and blow off. We estimate this blow off to be 500 scfm each or 1,000 scfm total. Unit #7 shows a minimum amp setting on the IR controller, but it appears to be pulling up to full turndown at 154 amps. This could be premature! Note that the integral aftercooler on Unit #6 appears to not be performing – 120°F air.
Settings on both units need to be the same so that you are not unloading prematurely. Check the controls and kW/amp to motor to see if you are at true full load or if there is some extra power left not being utilized.

High Pressure: The high-pressure system is comprised of four centrifugal air compressors. Two are normally in operation providing an average of 3,119 scfm of compressed air flow. These units are complemented by two diesel-driven rental compressors, providing a total of 2,392 scfm. Total high-pressure air flow is 5,511 scfm at 89 psig.
Unit #3 is running at full load, but the blow-off valve (BOV) appears to be leaking significantly, even though it is fully closed. Note that the blow-off line temperature starts at 250°F and is still at 200°F as it reaches the roof. You can also go up on the roof and feel the air blowing. We estimate this to be 350 scfm. This unit also has a cooling problem with the after-cooler. Note the 154°F exit air. The BOV valve needs to be repaired.
Unit #1 is pulling 203 amps according to the controller (7% over 189 max motor amps). However, the unit is at full turndown (60° on IGVs) and in blow-off (29% open BOV). The operating temperature (166°F discharge / after-cooler water 2°F rise) all indicate the unit is at very low load with significant blow-off (doesn’t go through after-cooler). This blow-off can also be observed and felt on the roof. This could be a control problem caused by a faulty transducer reading the amperage incorrectly. Estimated blow-off (1,000 scfm) total air available to recover at true full turndown load (estimated) – 3,036 scfm. Unit #1 needs to have the control system reviewed so it can truly run at full load.
On July 18 at approximately 1:30 pm, it was observed that one of the rental diesel-driven compressors had failed and was not running. At this point, we noticed that the high-pressure system’s pressure had fallen to 70 psig. The system ran this way until about 4:30 pm when the diesel was brought back on line. Several things were noticed during this time.
- Unit #1 compressor remained at the same load as it was at 89 psig (IGV @ 68° / BOV @ 29%)
- System pressure ran from 70 psi to 68 psi back in the Unitizer area
- We did not observe or hear of any production issues
It is recommended that the discharge pressure of the high-pressure system be lowered to approximately 75 to 80 psig.
EP System: There is one rotary screw compressor supplying compressed air to the plant’s EP system. The air compressor is located outdoors under a steel roof. The unit provides an average total of 416 scfm of compressed air flow at 109 psig.
Compressor Use Profile – Current System
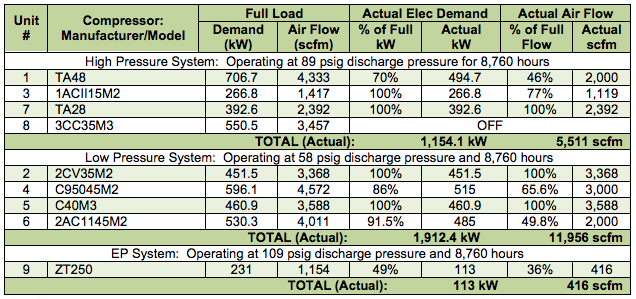
* The load on the current diesel rental compressors was transferred to Unit #7 (TA28) centrifugal.
Proposed System Changes
This project reduces compressed air demand by 559 scfm and then consolidates the supply-side.
Efficiency Projects
- Realign the high-pressure system to reduce demand and combine high-pressure and EP systems (22% efficiency gain)
- Realign the low-pressure system (18% efficiency gain)
Air Flow Reduction Projects (Total Reduction = 559 scfm)
- Replace open blows on 11, 12, 13 Shop Squeezers and other listed equipment (295 scfm)
- Reprogram PLC on Unitizers for vacuum generator timing (23 scfm)
- Repair tagged compressed air leaks (241 scfm)
Other Projects (Total Reduction = \$23,897)
- Put non-cycling 5,000 scfm refrigerated dryer into back-up mode ($23,897)
Compressor Use Profile – Proposed System
With Compressor Realignment and Air Flow and Discharge Pressure Reduction
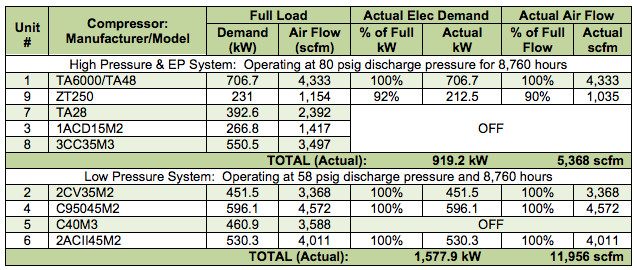
Note: ZT250 running at an average of 109 psig regulated down when fed into main high pressure system.
Proposed System Summary
With the air flow reductions considered, the savings potential of the projects related to operating the compressors total \$657,561. Adding in the savings potential of \$68,993 from other projected related to operating auxiliary equipment (e.g., refrigerated dryers and more efficient compressor motors) provides a total savings estimate for the entire set of projects of \$726,554. Together these projects can be completed at a cost of \$1,145,192 resulting in a simple payback of 19 months.
Comments to the Proposed High Pressure System
After the compressors are realigned to function properly and with air reduction projects, the high pressure demand falls from 5,511 scfm to 4,603 scfm. This demand is greater than the Unit #1 compressor can produce. There are no air saving projects for the EP system. It is running at 36% load – 416 scfm. This leaves 738 scfm available.
Our recommendation is to install a pressure/flow controller in the tie-in line (already installed) and regulate part of the remaining 738 scfm (namely 270 scfm) from this system into the plant high pressure system. This pressure would have to be the same as the plant pressure of 80 psig.
With this project, a second centrifugal would not have to be run as trim. The EP compressor has to supply higher pressure air to the EP system – 416 scfm. It would increase the load on the Atlas Copco from 36% to 59% load.
With the additional load on the rotary screw ZT250 unit, the cycle times will allow longer load and idle times. This will help to reduce the short cycling.
We also recommend tying the Unit #1 compressor into the header to the cycling dryer, leaving the non-cycling dryer as emergency back up, and then pipe back out to the system. This will utilize the existing oversized full-cycling dryer instead of a non-cycling dryer.
Conclusion
This factory illustrates what is so common with compressed air systems. The demands on the system change continually as the demands on the factory change. This project ended up qualifying for a \$626,000 energy incentive from a local utility. This helped provide a simple ROI of less than one year on a project providing the glass bottling plant with annual energy savings of \$727,000.
For more information contact Don van Ormer, Air Power USA, tel: 740-862-4112, www.airpowerusainc.com.
To read more System Assessment articles, visit www.airbestpractices.com/system-assessments.