Introduction
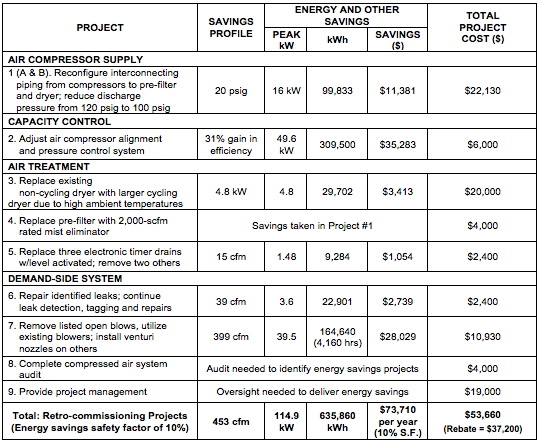
This factory, located in the U.S. northeast, spent an estimated \$120,000 annually on energy to operate the compressed air system. The group of projects recommended below reduced these energy costs by \$73,700 or 61% of current use. These estimates are based upon a blended electric rate of \$0.114/kWh.
Estimated costs for completing the recommended projects total \$53,600 - after receiving a \$37,000 retrocommissioning rebate from the local utility. The retrocommissioning incentive program, from the local utility, was important in that it incented demand-side system assessment work and the project management required to not only identify savings but to execute the projects.
This system assessment reduced compressed air system pressure by 20 psig and demand by 453 cfm. The supply-side was then modified so that only one VSD air compressors was required. The project was implemented by the factory, and the energy savings were verified by a third party. This verification triggered the payment of the \$37,000 utility incentive to the factory. Due to article length constraints, only selected energy-efficiency projects will be reviewed.
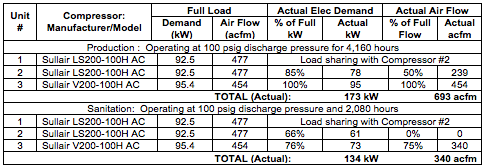
The compressed air system consists of three single-stage, air-cooled, Sullair 100-hp class, lubricated rotary screw compressors. There are two LS200-100H (115 Bhp), modulation-control units producing 477 acfm at 125 psig discharge pressure drawing 92.5 kW. The third compressor is a V200-100HA variable speed unit (122 Bhp) producing 454 acfm at full load. All compressors are running well and are located in the same compressor room.
Plant personnel report that the compressor room has some ventilation issues during the hot summer months. Compressor room ambient temperatures can get up to 115°F. This affects air compressor and compressed air dryer performance.
All compressors feed a Sullair SR1000 air-cooled, non-cycling refrigerated dryer. The dryer operates well, most of the year, but was not sized for the high ambient temperatures (115°F) and moisture is present in the system during the hot summer months. Next to the dryer is a 1 micron particulate pre-filter and a oil coalescing after-filter. The filters are performing well but pressure drops range between 5-10 psig
Establishing the Energy Baseline
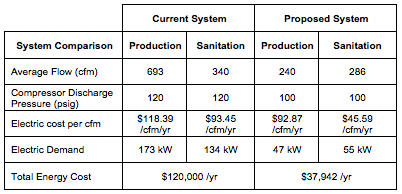
Annual plant electric costs for compressed air production, as operating today, are \$113,818 per year. If the electric costs of \$6,025 associated with operating ancillary equipment such as dryers are included the total electric costs for operating the air system are \$119,843 per year. These estimates are based upon a blended electric rate of \$0.114/kWh.
Production hours are from 05:00 AM to 11:00 PM five days a week. Sanitation is from 11:00 PM to 05:00 AM. The air system is shut-off during weekends. Plant personnel rotate the two LS200’s as the base-load machines. The V200 VSD unit acts as the trim unit.
The air system operates 6,240 hours per year. The load profile or air demand of this system is relatively stable during production then decreases during sanitation shifts. Overall system flow ranges from 693 acfm during production to 340 acfm during sanitation.
The estimated savings potential of the projects related to operating the compressors totals \$78,488 per year. Adding in the savings potential of \$3,413 from other projects related to operating auxiliary equipment (e.g., dryers) provides a total savings estimate for the entire set of projects of \$81,901. Together, these projects can be completed at a cost of \$82,600 (there is a 10% energy savings safety factor in the project summary).
Compressor Use Profile – Current System
Compressor Use Profile – Proposed System
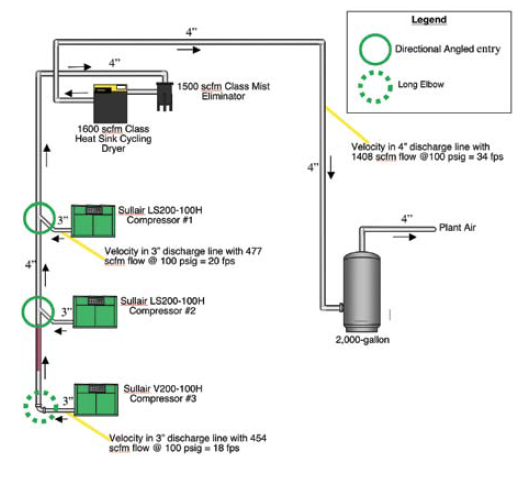
The Reconfigured Compressed Air System with New Piping.
Supply-Side Projects – Reducing Compressor Discharge Pressure By Addressing Piping Issues
The current system has inlet valve modulation on units #1 and #2; unit #3 has variable speed control. The current units have capacity controls capable of translating “less air used” into a comparable reduction in electric cost. These controls will not work effectively with the current piping and air receiver storage situation.
During our site visit we observed a 7 psig drop from the compressors to the receiver. Pressure upstream of the dryer and filters could not be measured so panel gauge readings of 119 psig, 119 psig and 120 psig were used. The dryer and filters are rated for 1,000 scfm each and the system demand was around 700 cfm. We believe the high pressure loss is partly caused by the interconnecting piping “T” connections and small pipe for the compressor collection header.
When we design piping systems, we size for a total horsepower (cfm) installed full load velocity of approximately 20 fps. Currently, the pipeline velocity in the 3” header is 43 fps.
We recommended replacing the existing 3” header with a minimum of 4” to a preferred 6” collection header with new discharge line size of 3” and angled directional entries. With the new 6” collection header and the new 3” discharge lines, all three compressors at full load velocity would be 34 fps.
If plant personnel believe they will need all three compressors in the future, the main collection header needs to be 6”. However, with the flow reduction projects implemented, our expected flow should have a velocity of 7 fps. The 4” would be able to handle up to 1,000 cfm with a velocity of 24 fps. This flow is approximately 30% above current demand.
After the repiping work was done, we reduced the air compressor discharge settings to 100 psig.
Demand-Side Projects – Use “No Air-Loss” Level-Actuated Condensate Drains and Replace Air Blow-offs with Venturi Nozzles
There are five electronic timer drains installed in the compressor area. These condensate drains should be replaced with “no air-loss”, level-actuated drains. This will save approximately 3 cfm per drain for a total savings of 15 cfm.
Electronic timer drains use an electronic timer to control the number of times per hour they open and the duration. In theory the frequency should be adjusted to ensure that condensate drains open fully and that the open time without water is minimized because compressed air is wasted. But in reality, cycles often aren’t reset from original factory settings, resulting in condensate build-up during the summer and being set wide open during cooler weather. When they fail in “open position”, they blow at a full flow rate of about 100 cfm.
Consider, for example, that the usual “factory setting” is 10 minutes with a 20-second duration. Some 1,500 scfm of compressed air will generate about 63 gallons of condensate a day in average weather or 2.63 gallons per hour. Each 10-minute cycle will have 0.44 gallons to discharge. This will blow through a 1/4-inch valve at 100 psig in approximately 1.37 seconds. Compressed air will then blow for 18.63 seconds each cycle, 6 cycles per hour, which will total 111.78 seconds per hour of flow or 1.86 minutes per hour of flow. A 1/4-inch valve will pass about 100 cfm. The total flow will be 100 x 1.86 = 186 cubic feet per hour, or 186 * 60 minutes = 3.1 cu ft/min on average. This 3 cfm would translate into an energy cost of \$300 per year based on a typical air flow cost of \$100 per cfm per year.
The drain locations are:
- Air compressor aftercooler separators – qty 3
- After-filter – qty 1 to be removed
- Dryer separator – qty 1 to be removed
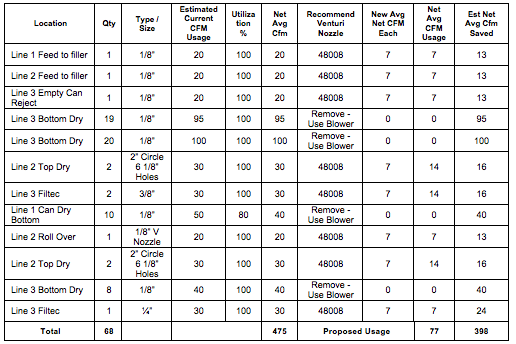
Currently the plant has in place Paxton low-pressure blowers in selected locations, such as the bottom dryer on all three lines. The plant is also using the compressed air system for many open-blow drying applications. We recommend removing the compressed air blows in these areas and installing venturi nozzles on the locations listed. In the top dry locations, use a AiRTX nozzle #48008 with adjustable height to cover both can locations in current top-dry locations.
| Estimated high pressure air used currently | 475 cfm |
| Estimated high pressure air used after installation of venturi nozzles | 77 cfm |
| Estimated compressed air savings with venturi nozzles and using blowers | 399 cfm |
| Value of air reduction | $70.25/cfm yr |
| Total electrical energy cost recovery by installing venturi nozzles | $28,029/yr |
| Cost of nozzles and installation (68 nozzles x \$100 each installed) | $10,930 |
Venturi Inducer Nozzles in Place of Open Blow
Conclusion
This system assessment case study is important in that it took place in a plant where the significant energy-saving opportunities lay in time-consuming “demand-side” and piping system improvements. Many plants struggle to find resources to contract a system assessment for this type of work. They also find it difficult to find resources in project management to execute these projects. The retrocommission energy rebate, from the local utility, made it possible for this plant to contract this project. The results speak for themselves and are available in most manufacturing plants.
Compressed Air System Projected Savings
For more information contact Don van Ormer, Air Power USA, tel: 740-862-4112
To read more System Assessment articles, visit www.airbestpractices.com/system-assessments.