Rockline Industries is one of the largest global producers of consumer products, specializing in wet wipes and coffee filters. The company contacted the Arkansas Industrial Energy Clearinghouse after identifying that the compressed air system in their Springdale, Arkansas facility was a potential source of significant savings. Experts from the Clearinghouse then began working with Rockline Industries, representatives of the electric utility, and a local compressed air vendor to perform a complete evaluation of the system.
The case study presented below provides the results of a “systems approach,” which evaluated both the supply and demand sides of the system to develop the most cost-effective solution for providing high-quality compressed air to the manufacturing processes (1). The main goals of the project were to increase reliability, decrease maintenance, and decrease operating costs of the compressed air system, all while maintaining the quality of the compressed air. Rockline Industries was also incentivized by the electric utility representatives based on energy savings. Overall, the project included piping retrofits, equipment upgrades, pressure control changes, and compressor retrofits. The team also provided measurement and verification of the overall project savings.
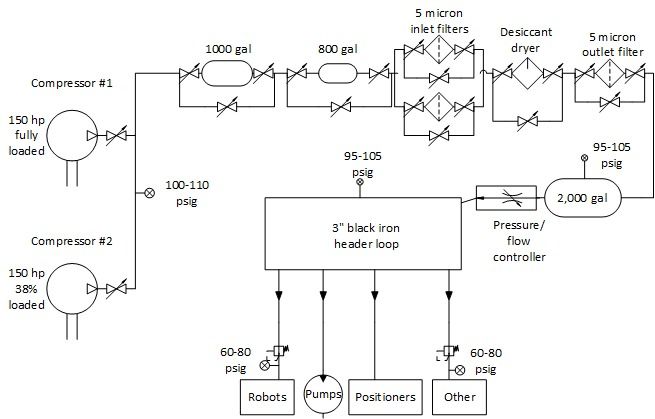
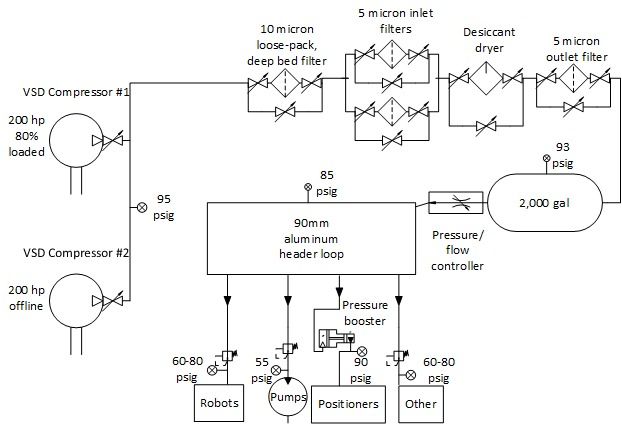
Figure 1: Schematic of the Original System Configuration
The Importance of the Systems Approach for Compressed Air Analysis
The component-level approach is often taken to improve a compressed air system, and it typically involves very specific, short-payback, and easily quantifiable measures (i.e. replacing an old compressor with a more efficient one). The Department of Energy and the Compressed Air Challenge, however, advocate a systems approach as the best practice for analyzing and improving a compressed air system. According to those organizations, the systems approach “requires not only addressing individual components, but also analyzing both the supply and the demand sides of the system and how they interact” (1).
The systems approach includes the following steps:
- Establish current conditions
- Determine process needs
- Gather baseline data
- Develop potential energy efficiency measures
- Evaluate financial and technical conditions
- Implement measures
- Gather verification data
- Continue to monitor and assess system
The systems approach can be more costly and time-consuming, but it has the potential to optimize the overall performance of the compressed air system. It also offers the opportunity to implement more savings measures by subsidizing some measures with the savings from others.
Systematically Analyzing Compressed Air Supply and Demand
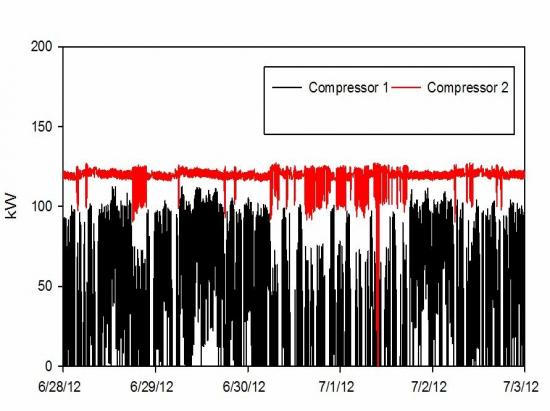
The existing compressors at the facility were identical 150-hp, single-stage, load/unload rotary screw compressors. The specific efficiency of these compressors was rated by CAGI as 18.7 kW/100 cfm at full load (2), and each of the compressors was capable of producing 678 acfm. Baseline energy usage collected by data loggers indicated that one of the compressors ran at nearly full load, while the trim compressor loaded and unloaded to control system pressure (Figure 2).
Figure 2: Baseline Data Log of the Existing Compressed Air System
The cut-in pressure for the trim compressor was set to 100 psig, and the cut-out pressure was set to 110 psig. The compressor room contained two wet storage tanks, with a total capacity of 1800 gallons. A heated desiccant dryer was also located in the compressor room. Dry air was sent into the plant to a 2000 gallon dry storage tank, which typically remained around a nominal 100 psig. There was also a pressure/flow controller located between the dry storage tank and header loop, but the pressure controls were set to maintain maximum pressure downstream of the controller, essentially bypassing it.
The distribution system consisted of a 3-inch cast iron pipe header loop, which supplied air to all of the end uses in the facility. The main header connected to diaphragm pumps with separate, unregulated drops. There are 12 of these pumps, which are used to move lotions and other fluids. On average, each pump was being replaced about every 2 months, largely due to mechanical failure caused by over-pressurization.
Reducing Leaks and Eliminating Downtime with Aluminum Piping
The project began by replacing the 3-inch black iron header with a 90-mm aluminum piping system. The old header was more than 20 years old, and the iron pipe had degraded over time. When a recent air compressor event sent oil into the header, the entire plant was shut down for several hours while the bulk of the oil was drained from the piping. When the system started back up, the plant had to deal with excess oil in the system, which was trapped in the pores and rough surface of the degraded pipe.
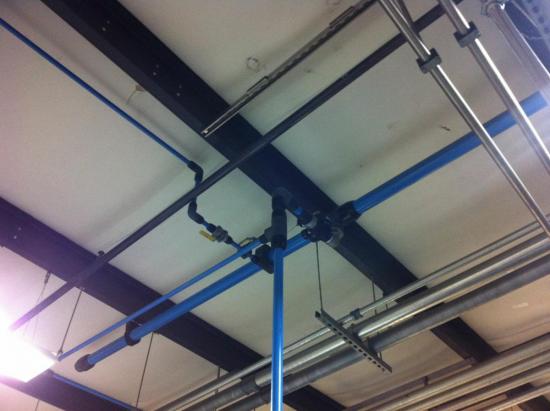
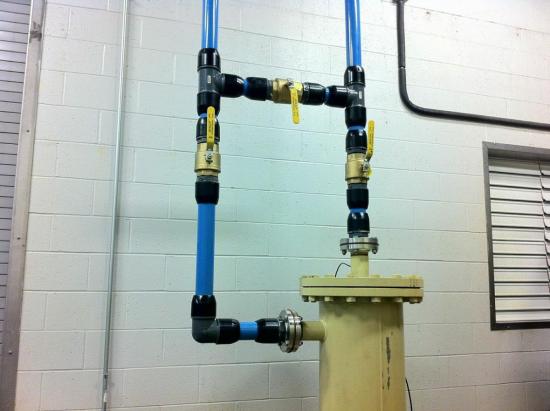
The new piping system (Figure 3) was selected because the aluminum pipe will not corrode over time. In addition, the time to install the aluminum piping was significantly less than the time it would have taken to install a new threaded or welded steel piping system, thanks to slip fit connections. Lastly, a properly installed aluminum piping system should theoretically never leak, while iron or steel pipe undoubtedly will.
Figure 3: Aluminum piping system — The aluminum pipes are blue in color and slip fit connectors are black.
Optimizing Diaphragm Pumps to Reduce Demand
The company turned to a local compressed air vendor to properly size and configure the pumping system. They focused on improving the reliability of the pumps, thereby reducing the annual maintenance costs associated with replacing failed pumps.
Diaphragm pumps are typically rated for a maximum pressure input. This is the pressure at which it is safe to operate the pump. The pumps also typically have a minimum input pressure, which is the pressure below which the pump may stall or cease to operate properly. The pump speed changes with pressure, and the pump flow rate changes accordingly. Therefore, the pump speed and duty can be significantly reduced, saving energy at the cost of time.
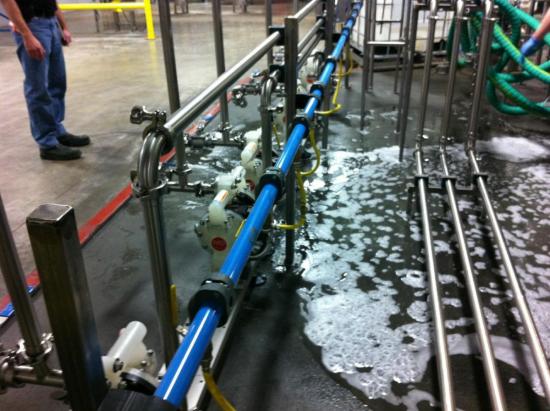
If the time penalty is acceptable, then the pressure reduction can yield a significant savings. The company decided that they could reduce the line pressure from 100 psig to 55 psig with no negative impact on production (Figure 4).
Figure 4: Diaphragm pump header regulated to 55 psig.
Flow Controller and Booster Help Reduce Plant Pressure
The existing system’s average pressure was 100 psig, which included about 5 psig of drop through the treatment equipment, and a 10-psig differential from the load/no load controls. This meant that while the compressors were modulating between 100 and 110 psig, the header was seeing a pressure range of 95 to 105 psig. The additional pressure drop of 5 (or more) psig from the last “dirty thirty” (3) meant that end uses were receiving about 90 psig before the trim compressor loaded, and about 100 psig before it unloaded.
The highest pressure end use in this facility includes a set of electropneumatic positioners for pneumatically actuated control valves. These positioners become unreliable when the supply pressure drops below about 90 psig. If one of the positioners fails on low air pressure, it could cause a production line to shut down or generate scrap products. The header pressure was apparently set to provide a minimum of 90 psig to these controllers.
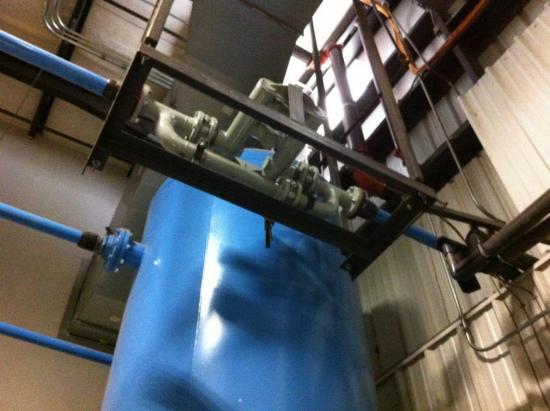
Most of the end uses in the facility, however, were regulated in the range of 55 to 80 psig. The intrinsic air consumption of the electropneumatic positioners is zero cfm (4), since their method of operation is to position an actuator. As long as the actuator is in the same position, no air is consumed. This is the definition of a “flow static” application, which made it a perfect candidate for a pressure booster. A 2:1 pressure booster regulator (5) was installed at the bank of positioners, and set to an operating pressure of 95 psig, ensuring sufficient supply pressure for the devices. The plant header pressure could then be dropped to 85 psig, allowing for a 5-psig drop to the end uses regulated to 80 psig. Plant pressure is regulated by the original pressure/flow controller (Figure 5).
Figure 5: Pressure/flow controller regulating plant pressure to 85 psig (bottom view with tank shown).
New VSD Air Compressors Improve Energy Efficiency
Rockline Industries installed two identical 200-hp, 115-psig-rated, VSD, single-stage, lubricant-injected rotary screw compressors. The company chose these compressors so it could operate one compressor normally, with the second compressor acting as a 100 percent redundant backup.
The new compressors have a specific efficiency as low as 19.0 kW/100 cfm at full operating pressure, with slightly higher values at full flow and full turndown. They are slightly less efficient at full load than the old compressors, but thanks to VSD technology, they are substantially more efficient at part load than the original compressors.
Analysis of the logged data from the old compressors (Figure 2) shows that the lead/lag control scheme yielded an overall specific efficiency of around 21.8 kW/100 cfm. Analysis of logged data from the new compressors demonstrated an overall specific efficiency of 19.4 kW/100 cfm.
Storage and Piping Changes Reduce Footprint and Maintenance Costs
The two wet storage tanks were removed completely from the compressor room. While this is not a common measure, it made sense in this case. With VSD compressors, the added system volume increases the ride-through time available if the main compressor unexpectedly goes offline and the backup has to start (6), but there is no energy efficiency benefit.
The added storage capacity also came with a significant number of valves, fittings, and potential maintenance issues. Removing these extra tanks simplified the compressor room piping (Figure 7), eliminating the pressure drop associated with them. It also eliminated the need for the two extra ASME pressure vessels to be annually inspected and certified.
Figure 6: Final Compressed Air System Configuration.
Removing the wet storage tanks also created space for a mist eliminator filter (Figure 6). This 10-micron filter has no measurable pressure drop, and removes a significant load from the 5-micron filters that are required upstream of the desiccant dryer. This large filter will reduce the maintenance cost for the 5-micron filters by extending the time between required cartridge replacements. Alternatively, if the 5-micron filters are serviced at the same intervals, the pressure drop will be reduced due to the reduced loading.
Figure 7: Mist eliminator filter and associated piping.
Using Data Loggers to Analyze the Results
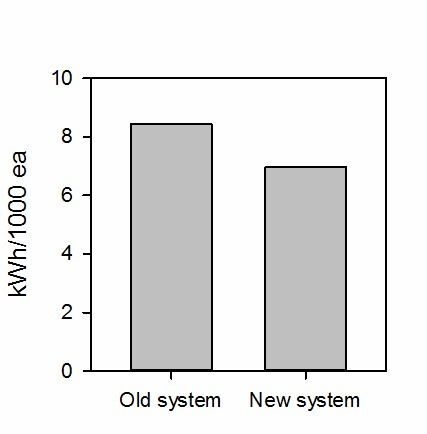
Data loggers were also deployed to measure the energy consumption, and production data was analyzed to determine the energy intensity of the new system. The average power of the old system was 168.8 kW (Figure 2). The average power of the new system was 121.5 kW (Figure 8). While this difference in average power is not representative of the actual energy savings because of differing production levels, the actual energy savings can be more closely estimated by calculating the energy intensity, or energy per unit of production, for each period. The calculated energy intensities were 8.432 kWh/1000 ea. for the old system and 6.982 kWh/1000 ea. for the new system (Figure 9).
Figure 8: Average Power Recorded for the New System.
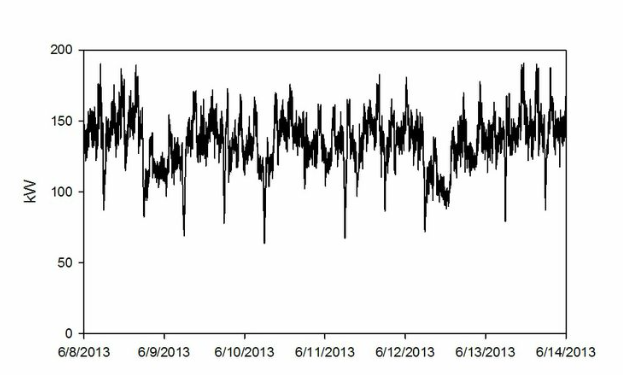
Figure 9: Compressed Air Energy Intensity.
An annual energy savings of over 242,000 kWh was achieved, representing about 17.2 percent of the baseline compressed air energy usage. The average power was also reduced by 47.3 kW between the two logging periods, so the annual demand savings is likely on the order of 500 to 600 kW-mo/year.
The 17 percent savings includes the energy efficiency improvement of the compressors, which was about 11 percent, as well as a reduction in compressed air consumption from the diaphragm pumps, which was about 1.4 percent. The change reduced compressed air use by about 17 percent and reduced annual pump replacement costs by a projected \$4,900 annually.
Figure 10: System Energy Breakdown
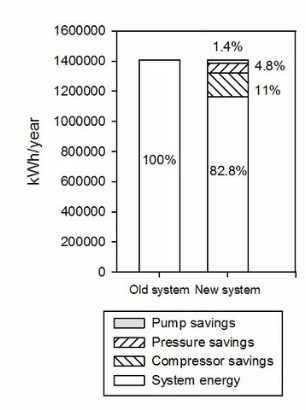
The other 4.8 percent of the baseline system energy usage was saved through the combination of the reduction in artificial demand due to the header pressure reduction and the decreased friction in the new aluminum piping. At an average cost of \$0.072/kWh, the project reduced the annual utility cost by just over \$19,000.
The maintenance savings detailed above amounted to an annual savings of nearly \$7,000. When all four stages of the project were considered, and the utility rebate included, the total cash outlay for the company was just over \$70,000, which yielded a simple payback of just less than 3 years.
To read more articles about System Assessments, please visit www.airbestpractices.com/system-assessments.
For more information visit the Compressed Air Challenge® website or contact Ron Marshall, Marshall Compressed Air Consulting, tel: 204-806-2085, email: ronm@mts.net.
References
-
Energy, U. D. (November 2003). Improving Compressed Air System Performance: A sourcebook for industry. Washington: Energy Efficiency and Renewable Energy.
-
CAGI. (2012). Performance verification. Retrieved February 10, 2014, from Compressed Air and Gas Institute: https://www.cagi.org/performance-verification/data-sheets.aspx
-
Marshall, Ron. (n.d.). The "Dirty Thirty" - Discovering perssure differential at the far end.
-
Burkert USA. (n.d.). Top Continuous Control. Retrieved February 10, 2014, from www.burkert.us: https://www.burkert.us/products_data/datasheets/DS8630-Standard-ES-ES.pdf
-
Shi, Y. M.-L.-P. (2010). Flow Characteristics of pneumatic booster regulator. Journal of Harbin Institute of Technology, 2013-2016.
-
Wogsland, J. (2001). Compressed air system upgrade improves production at a steel mill (The US Steel Mon Valley Works). Case study, National Renewable Energy Lab, Office of Industrial Technologies, Golden.