A food processor in Western Canada hired an auditor to assess the energy efficiency of its compressed air system. The results revealed surprises about the operation of some important elements of the system, and detected that the air compressors were having control gap problems. Additionally, the audit led to initial energy savings of \$20,000 – and identified the potential to achieve overall operational savings of 45%. The following details some of the audit findings and results.
Background
The plant system consisted of three 75 horsepower (HP) air-cooled lubricated screw air compressors, one of which was a Variable Speed Drive (VSD) version. All three air compressors were connected to a sequencing controller to orchestrate the efficient operation of the air compressors during variations in compressed air demand.
A single heated blower-type desiccant dryer with pressure dewpoint control (EMS) was installed to produce dry compressed air for plant operations. The system also has a mist eliminator filter and high-efficiency coalescing filter installed before the air dryer, with a particulate filter after the dryer.
Two medium-sized 660-gallon storage receivers are located in the air compressor room as wet and dry control storage. A pneumatically operated pressure/flow control valve regulates plant pressure, however, it was not set to regulate at the time of the assessment.
The compressed air is delivered to multiple production areas through a 2-inch-piping header from which various branches are tapped to supply each production machine. The piping is arranged in a radial feed for the two main production areas. Data loggers showed minimal pressure loss across the piping system. Most of the pressure loss is across the drying and filtering system.
The shape of the compressed air flow demand curve at the end of the data logging period can be seen in the green line on the following chart:

Figure 1: Shown is the shape of the compressed air flow demand curve. Click here to enlarge.
The profile shows a somewhat random pattern during production activities and very low flows during shutdown periods. The highest peaks were seen during nighttime cleanup activities where the air-powered vacuum and blow wands might be used at the same time the dryer cooling purge is flowing. These peaks required all three air compressors to run. The pressure profile shows very good pressure regulation on the upstream side of the dryer, but poor regulation of plant pressure especially during peak flows on the downstream side. This is associated with the air dryer and filters, and made worse by undersized air compressor room header piping.
Amp loggers were used to monitor the compressed air system’s electrical consumption. Kilowatt readings were performed for both active air compressors using a handheld meter to calibrate amps to power. System flow was recorded by placing a logger on a newly installed main flow meter at the output of the pressure/flow controller. Pressure loggers were located at the wet receiver, dry receiver, after the pressure/flow controller, at the bagging area and near one of the end uses. The following baseline was determined over a five-week period:
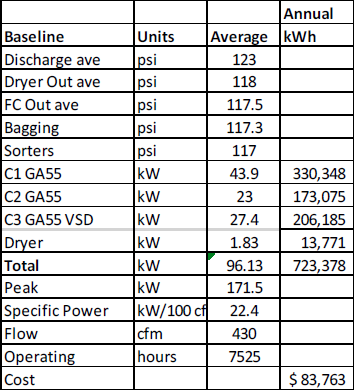
Figure 2: The baseline collected during initial measurement period.
The readings and observations during the measurement period show the compressed air system was producing air at fairly good efficiency (22.4 kW/100 cfm with dryer excluded). Yet problems with the air dryer cooling purge flow, higher-than-needed discharge pressure, some small leakage and drainage issues, and some inappropriate high-flow uses are causing higher than desired operating costs and occasional pressure issues. The study found that significant improvements were possible.
A survey of the demand-side of the system was done including leakage. A total of 10 leakage points were found, estimated at 20 cfm. The survey also found one end-use involving an air-powered vacuum consuming 180 cfm, which might be classed as an inappropriate use.
Air Compressor Control and Control Gap
Early into the assessment the auditor found periods of time where a control gap was causing the air compressors to fight for control.
The graph (Figure 3) shows the VSD alternating between full load and minimum speed at the same time the fixed-speed air compressors are loading and unloading. This is caused by a sizing mismatch between the capacity of the system variable and fixed-speed air compressors. In order to avoid control gap, the size of the variable capacity range for VSD air compressors must be equal to or larger than the size of the fixed- speed air compressors with which it must work. In this case, since the VSD unit has an 80 percent turndown (80% x 75 hp = 60 hp of variable capacity) and the fixed-speed capacity is 75 hp, the sizing rule is broken. The correct sizing would have been a 100-hp variable air compressor. As a result of the mismatch, there are flow ranges where a fixed-speed (or a combination of multiple fixed speeds) machine is too large for the flow, but where any combination including the VSD unit is too small. This causes the air compressors to fight for control, causing inefficiency and excessive swings in pressure.
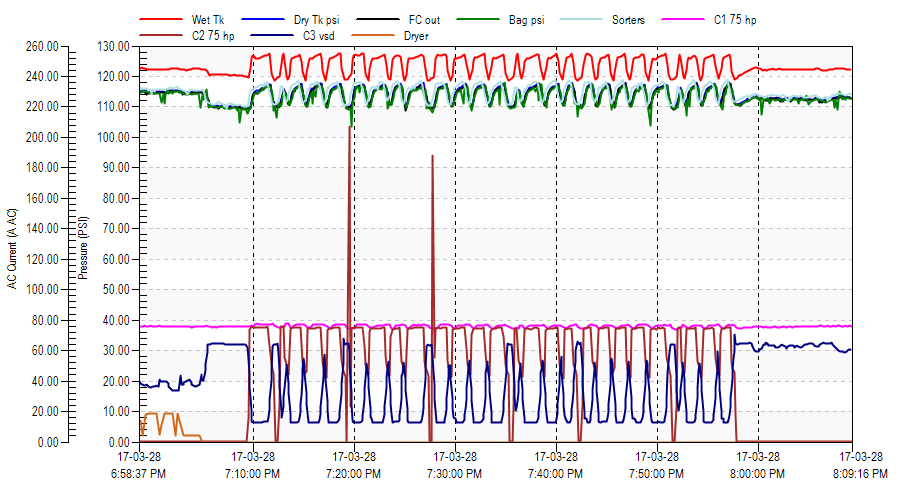
Figure 3: A control gap problem shows the air compressor fighting for lead control.
This condition can be almost totally corrected by allowing the full capacity of the VSD to be used, but doing this may allow the unit to run in start/stop mode below minimum speed for extended periods, not a recommended way to operate variable units. The full range of the VSD is used by adjusting the stop point of the VSD so it is lower than the unload point of the fixed- speed units, which in this case, are controlled by a central system controller.

Figure 4: Shown is the baseline once the control gap was corrected. Click here to enlarge.
The air compressor controller purchased with the units would not allow the variable air compressor to run in start/stop mode, so the unit had to be removed from the central controller with only the fixed-speed units left to run on a single pressure band. This corrected the problem, allowing the units to run without control gap. Due to the characteristics of the plant flow profile, there are currently no periods of extended operation below minimum speed.
Air Dryer Problems
As part of the compressed air assessment, a main flow meter was installed to capture the flow profile with data loggers. From the initial installation, some strange results were noticed. The plant flow was averaging between 200 cfm and 600 cfm during main production, yet three 320 cfm-rated air compressors were sometimes required to run. As part of the assessment the auditor typically tests desiccant dryers and noticed that whenever the dryer was placed in standby mode for test, with no cooling purge flow, one air compressor unloaded and turned off.
Typically, when a heated blower style dryer re-pressurizes, after a regeneration cycle, air for pressurization transfers from the active side to the other tower through a large valve sized so the operation takes only a few seconds. After a heating cycle ends, a smaller cooling purge valve opens to send a low flow of air, about 7½ % of the dryer rating, to the side being regenerated.
A careful inspection of the dryer found that, likely since installation, the operation of these two control valves were reversed, allowing a very large flow of compressed air into the depressurized side for the cooling cycle. In addition to this, the cooling purge valve was stuck open, allowing even more air into the regenerating side, even when no air was to be flowing during operation of the heated blower cycle. Enough air was flowing to require one extra air compressor at peak.
The extra air required for the dryer was causing excessive pressure loss across the dryer and filters, reducing the pressure available to the plant. The data loggers showed that about a 12 psi differential was developing across the air dryer and filters. This low pressure required the air compressor discharge pressures to be boosted to above 120 psi to compensate, causing the air compressors to consume more energy per-unit output.
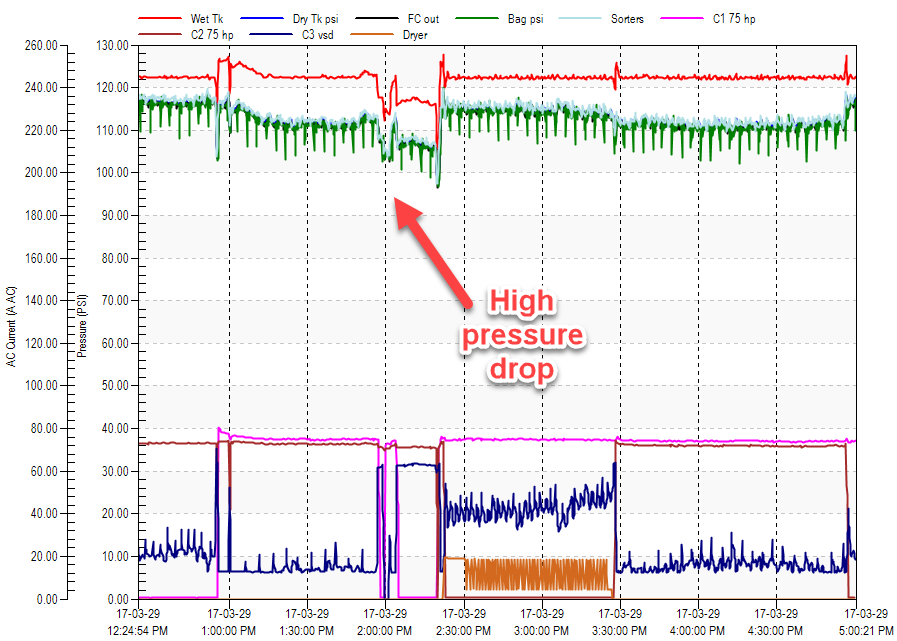
Figure 5: High flow was causing excessive pressure drop.
This condition was corrected by repair of the dryer, and as a result only two air compressors now run during peak, saving the third air compressor as a standby unit. This correction greatly reduced operating costs.
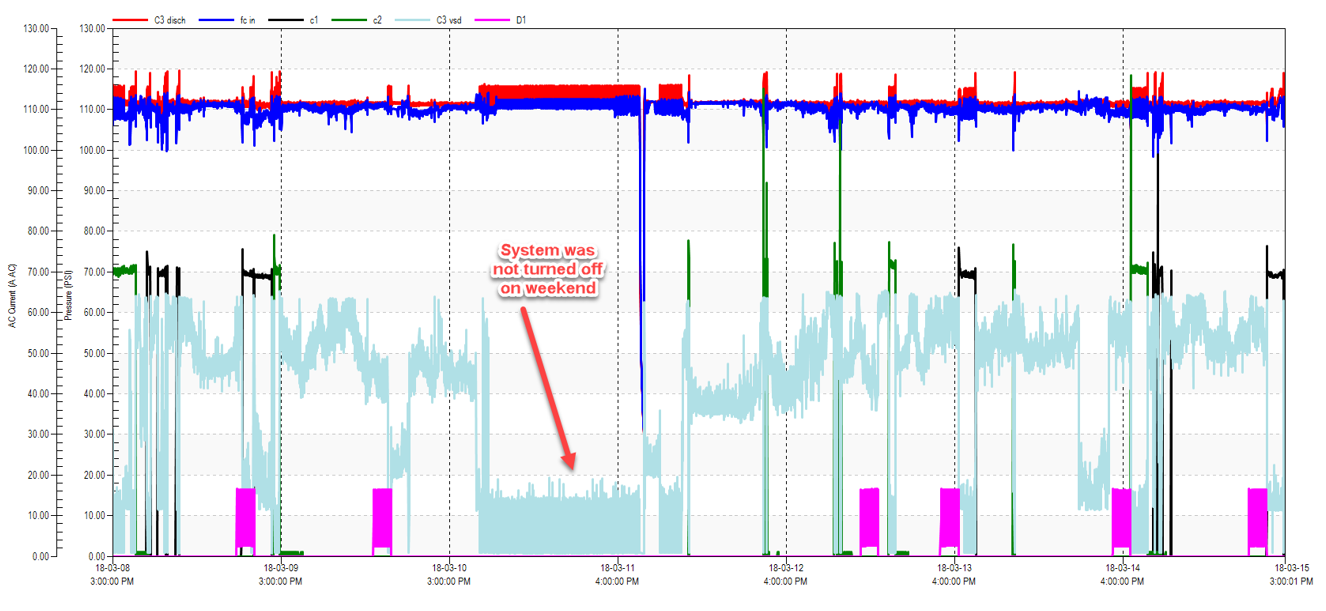
Figure 6: Shown is the baseline after the dryer issue was corrected. Only two air compressors are required to meet peak demand. Click here to enlarge.
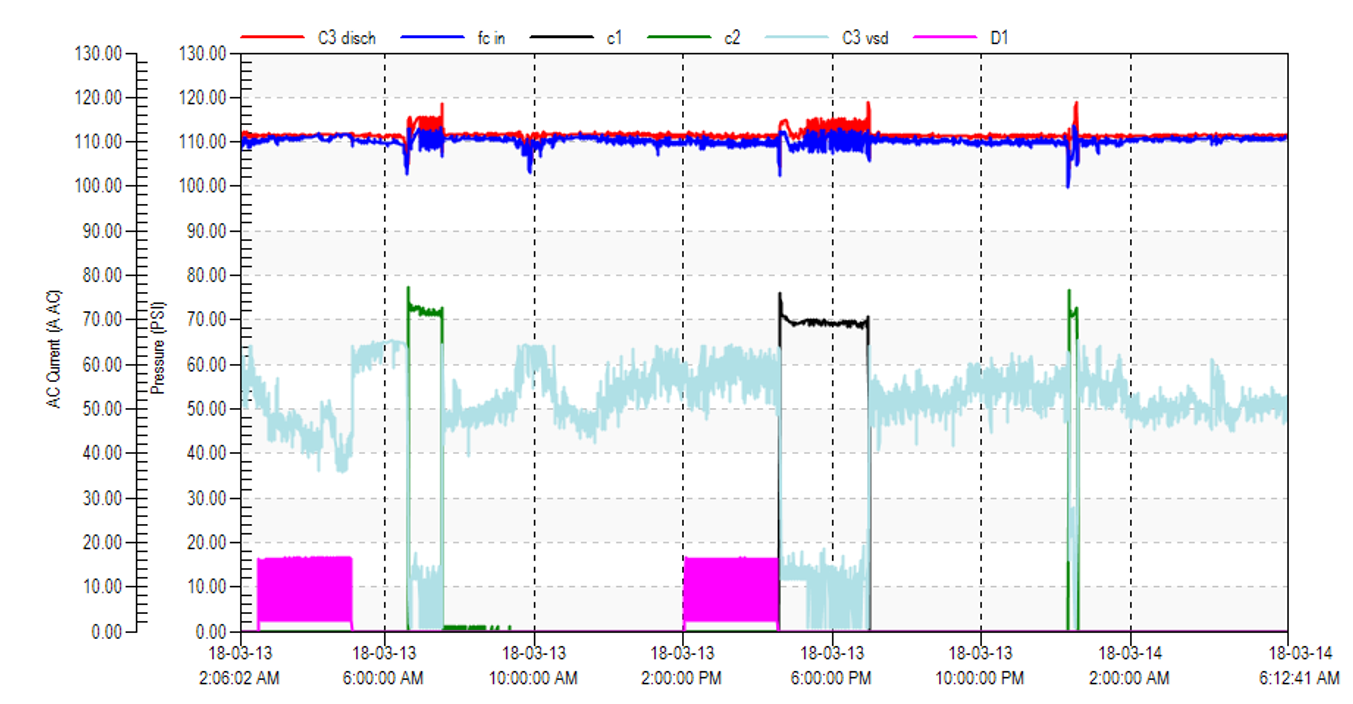
Figure 7: The final profile shows the air dryer still has significant effect, starting an extra air compressor to feed cooling purge, but the air compressors are not fighting in control gap.
Recommended measures
Other energy reduction measures recommended:
- Reduce air compressor discharge pressure settings and lower plant pressure by adjusting the flow control valve to regulate.
- Correct air compressor controller to allow VSD to be centrally controlled.
- Increase the size of air compressor room piping.
- Reduce plant leaks.
- Eliminate a number of timer drains that were wasting compressed air.
- Correct air dryer purge.
- Eliminate a compressed air powered drum vacuum that was causing a high plant peak.
- Properly maintain main filters to eliminate pressure loss.
- Consider refrigerated drying (only one end-use was located outdoors, all other end uses were in heated conditions).
The estimated potential energy reduction for these measures would result in 45% lower energy consumption and better-stabilized pressure.
Interim Results
As part of an energy program offered by the local power utility, the compressed air assessment was funded at 100% with 50% after the final report and 50% when significant energy efficiency measures were adopted. A baseline was taken after the plant took some action, although not all recommended measures. This resulted in the following baseline:
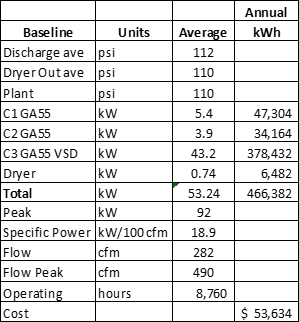
Figure 8: The final baseline shows \$20,000 in energy savings and better system efficiency.
The results showed lower energy consumption for a savings of about \$20,000 in operating costs. Additionally, because the control was corrected, and discharge pressures are lower, the specific power of the system dropped from 22 kW per 100 cfm down to 19 kW per 100 cfm. These results were enough for the local utility to grant funding for the full cost of the study. A further energy program for projects awaits completion of the remainder of the work.
Conclusion
The results of this study, and the additional baseline, show that assessing a system can find unexpected items of concern. This system was fairly new, with newer cutting-edge air compressors with excellent efficiency, a modern control system, and energy-efficient air dryer, yet problems were occurring that were unknown to system operators. It was only after the system was measured with monitoring instruments, and analyzed, that the items of waste were discovered.
There are problems and potential savings hiding in almost every compressed air system. If a plant isn’t regularly monitoring your system there could be some unpleasant surprises waiting. Bringing in an auditor for an assessment is a good start on the road to improvement.
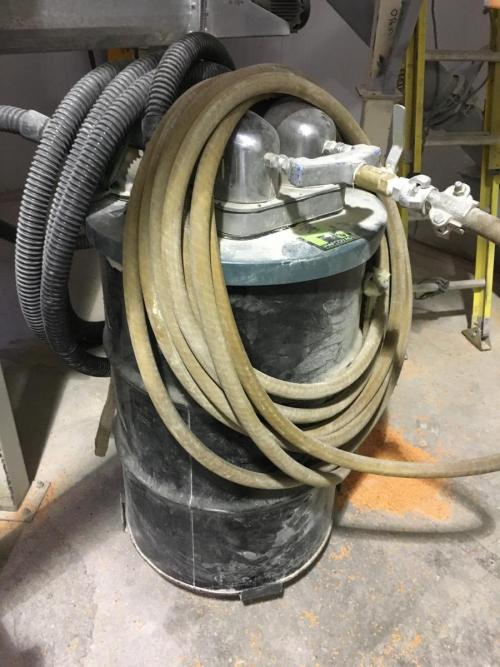
Figure 9: This compressed air powered drum vacuum adds to plant peak.
For more information contact Ron Marshall, Marshall Compressed Air Consulting, tel: 204-806-2085, email: ronm@mts.net.
To read more System Assessment articles please visit www.airbestpractices.com/system-assessments.