In my 24-year career monitoring of compressed air systems for energy efficiency, I have spent many hours of dashboard time, traveling by air and car, to and from my customer’s sites both within my territory and beyond, even sometimes on other continents. Sometimes due to unforeseen circumstance I will download data from previously placed loggers only to find the data is unacceptable, meaning the time spent traveling has been wasted, this is a constant source of frustration. Recently, with the advances in instrumentation and cell-connection technology, it has become possible to make this exercise much more efficient, reducing wasted travel time, and yielding much more valuable real-time information about the working of the customer’s equipment.
These improvements not only reduce my travel time, but also the time spent processing the downloaded data, which often contains hundreds of thousands, sometimes millions, of time-stamped samples needing to be carefully analyzed. This article discusses some of my experiences in trialing some new cell phone-connected compressed air data logging equipment and data visualization software.
Data Logger Types Explored
Like any system, to properly manage compressed air equipment some measurements have to be taken. Typically, some sort of data logging equipment is installed to measure various pressures, amps or power, flow, and sometimes temperatures and dewpoints. Placing this equipment on a system is like putting an electrocardiograph machine on a human heart, the heartbeat of the compressed air system in a plant can be analyzed to determine if everything is normal or if there is a problem, all without interrupting the system.
The shape of the squiggly lines, say the pressure profile when compared to the air compressor power consumption, tells an educated auditor many things about the compressed air equipment. Things like lack of air capacity, high pressure, poor control, large pressure drops, and inefficient air compressor operation all become obvious when the traces for the various parameters are compared side by side on a time-based chart.
There are many types of data loggers, and I have tried quite a few. Generally, the loggers available are either one of two design philosophies: self-contained independent, or central multichannel.
The self-contained designs are usually battery powered and lightweight, often designed to measure only one or two of the required parameters, the user must have a number of pressure, amp and flow loggers to be used to concurrently collect the various required readings. These data loggers typically have their own power supply, making them easy to place anywhere, but usually have limited onboard memory and selectable data sampling rates. There is often a trade-off between the frequency of samples and the measurement time span, due to limitations in memory size. The lower the sample frequency the harder it is to analyze system data.
The other type, central multi-channel loggers, are usually some sort of electronic enclosure connected by control wires to the various temporary transducers required for measuring the important system parameters. The use of this logger type is less convenient because of the many wires that need to be run to a central location in larger compressed air installations. These boxes usually need to be connected to AC power to work, or a larger battery pack, adding the risk of accidental interruption. Central data collection boxes often have huge memory capacity, capable of collecting months of data at frequent sample rates, making data analysis clearer.
Both design styles require some sort of data download. After placing the loggers, and waiting a period of time, the compressed air auditor will return to site and download the data loggers. The data will then be organized into some sort of database where visualization of the data can be done, and energy calculations performed. The processing and visualization of the data is very important since the auditor must be able to easily scan the data to look for any problems. Having the ability to zoom in and out of the data to take a close look at any abnormalities is paramount. This operation, or the lack of it, is what makes some data logging systems easy to use and others almost impossible. The least convenient type of data logger is one with no data visualization program at all, forcing the compressed air auditor to dump everything into a spreadsheet and struggle from there.
Web-Based Systems Evolve
Of course, with any electronic circuitry, there are problems. Batteries go dead, wires are pulled off, power supplies unplugged and open valves closed, all with negative consequences to the data collection exercise. And without the ability to see real-time data, the auditor must wait for the one or two weeks of data collection before he can determine if his data is bad or good. Many times I have been forced to emit a stream of expletives after finding, after a six-hour drive each way, that my data loggers have failed to collect the data correctly.
These struggles have forced me to look for the perfect compressed air data logging system, something that will make my life easier, and in the past number of years I have tried about a dozen system, some very good, but none perfect.
Advances in electronic instrumentation and data connectivity, however, have finally allowed me to find the near-perfect product I was searching for: a cell-connected data logging system designed for compressed air systems. This system I am currently using, available from CALMS AIR (www.calms.eu) is a central box system, capable of using multiple, multi-channel loggers working together on the same database, with live cell modem Internet data connection.
The device connects to various transducers via wiring and collects the data in ten-minute packets, which are sent to a central database. The incoming data is scaled and processed within web-based software. Each data point is subject to mathematical calculation, which makes it possible to calculate power from amps using the power formula and “if, then” statements to select the proper power factor.
The available web platform allows any auditor who is assigned to a project, no matter their location, to look at any connected monitoring system or historical data from anywhere in the world that has an internet connection. This makes it possible to view real-time data from my customers (delayed by a maximum of 10 minutes) from my desk or laptop, and even my smart phone if desired.
I have been fortunate to have been able to trial this system, and in the few short months I have been using it, I have already saved myself an estimated 30 hours of dashboard time. I’m also proud to say that, due to the excellent connectivity and real-time data, the system has allowed me to advise my customers from afar, and on four occasions I have been able to help improve my customers’ system efficiencies by an average of 10% by doing no cost adjustments to air compressor settings.
The system has also allowed me to very quickly diagnose system problems as they happen, or within few short hours after the initial installation of the equipment. And of course, because much of the data processing is automatically done after each sample is taken, much of the spreadsheet work I usually do in calculating system efficiencies and flows is already done for me, saving me many additional hours of work. The following examples illustrate some interesting uses of this excellent measurement system.
Saving Time, Improving Results at Bean Processing Plant
The first use of the system was in a bean processing plant, about a two-hour drive from my office.
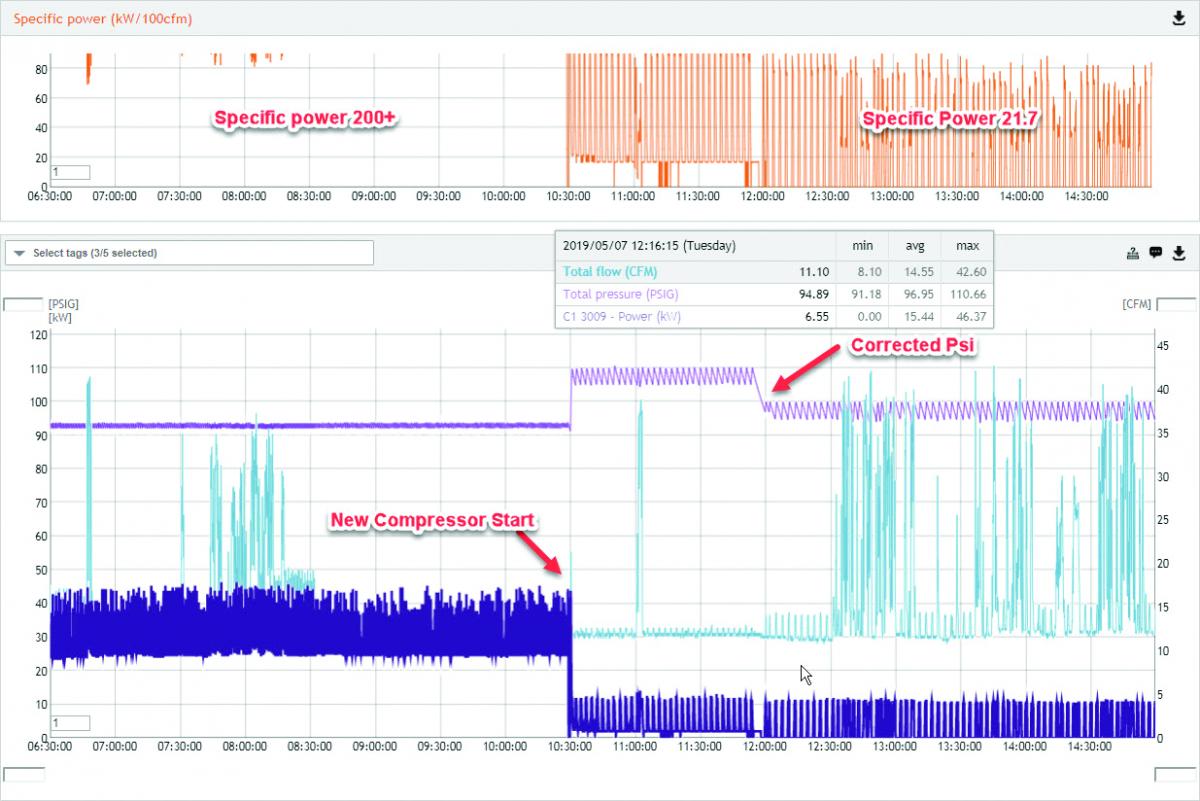
Figure 1: This chart shows pressure (magenta), power (purple) and flow (blue) at a bean processing facility. The power signal is from a common feed, halfway through the sample a new more efficient air compressor is started. Within an hour high pressure and less than optimal operation was detected based on remote readings and adjustments were made to correct the situation before the technician left the site. (Source: CALMS Air.) Click here to enlarge.
This is a single air compressor system with a desiccant dryer. The customer was changing the plant air compressor from a load/unload-controlled unit to a Variable Speed Drive (VSD) design. The existing air compressor was extremely inefficient because it was rapidly cycling and had very high unloaded power consumption. This project was being funded by the local power utility, so they had an interest in verifying the savings gained by the equipment change.
The old and new air compressor were connected to the same power supply, so the same current transformers could be used to measure both old and new operation. The data logger was set up to measure basic parameters of air compressor discharge pressure and amps. During installation the power factor was measured with a handheld power meter in both loaded and unloaded conditions. This is to internally calculate the power consumption using a mathematical calculation on the amps input.
The customer was unsure when the air compressor replacement was going to take place so the data logger was pre-installed well ahead of time and left collecting data. This gave a good set of data to calculate a baseline energy and flow profile. Once the new air compressor was installed, I could quickly see the result from my office. Figure 1 shows the pressure/power/ flow profile of the load/unload air compressor in the first half of the chart, then similar measurements when the new unit was first started up.
Above the main chart is a calculation of the specific power of the system. We can see for the load/unload operation the specific power was off the chart. Operation in this range had a power consumption of 28.4 kilowatt (kW) while producing an average of 14 cfm. This calculates to a specific power reading of over 200 kW per 100 cfm, very poor. Operation after consumed about three kW while producing 15 cfm, for a specific power of 21.7 kW per 100 cfm, a much more reasonable number.
A pressure excursion can be seen midway through the data, when the new air compressor was started up, the service technician assumed the pressure should be set at around 110 psi, when the desired pressure was lower. The technician’s set-up also allowed the air compressor to run unloaded between cycles, consuming power, but producing no air. Since I was receiving data remotely, I was able to quickly diagnose the problems and advise the technician to lower the pressure and reduce the unload timer. This saved me a trip to site and increased the energy savings for the project.
A bit later on, the measurement system was able to help me diagnose a problem with the air dryer dewpoint control. The site personnel had switched the dryer to fixed-cycle mode, this problem was noticed during my daily checks, but not by the customer. A phone call to site corrected the issue, saving another wasted trip. Overall, I was able to collect about a month of data without the need for extra trips to download data. My old data loggers had a capacity of only eight days per download. As such, this would have required four separate trips to site to download data.
IoT and Compressed Air Management Systems – Webinar RecordingDownload the slides and watch the recording of the FREE webcast to learn:
|
Pinpointing Savings of \$10,000 Annually at Meat Processor
At a meat processor I got the first opportunity to use two logging boxes connected together to the same database via cell modem.
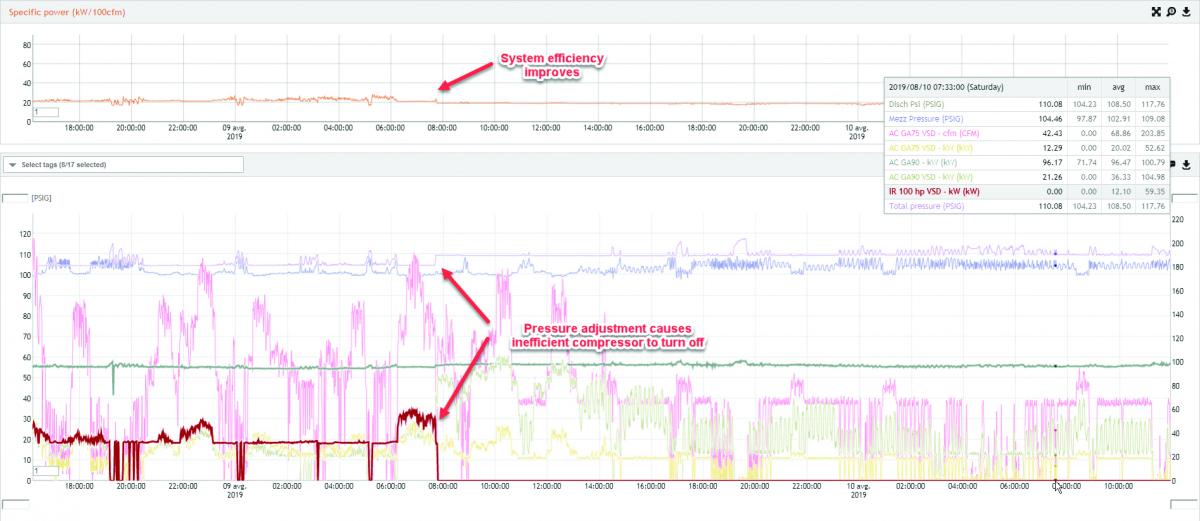
Figure 2: This shows the pressure, power and flow profile at a meat processing plant. The three VSD air compressors at this site were not running optimally. Based on the readings, the pressure setting was adjusted on one of the VSD air compressors causing a less efficient unit to shut down. The specific power graph on the top of the chart shows this adjustment improved the efficiency. (Source: CALMS Air.) Click here to enlarge.
The plant has three VSD air compressors and one fixed-speed unit. Air drying is heatless desiccant, which is needed due to cool ambient temperatures in the plant. One of the air compressors is installed remotely from the main powerhouse to provide pressure support to a critical process area. This required two measurement boxes as it was too far to run wires to a central location. Two of the four air compressors have just recently been purchased and were premium efficiency units. One older VSD unit is nearing the end of its useful life and had very poor efficiency when it was in the low range of its variable adjustment.
It was difficult to adjust this system by local observation due the fact that there is no compressed air monitoring system and the remote air compressor operation could not easily be checked. The remote unit is isolated from part of the plant through a check valve. This was done so the critical process could run independently from the main plant if the main production pressure went down.
After the loggers were placed, it was obvious things were not adjusted as expected. The older inefficient VSD was running most of the time in its lower range, its least efficient point, and the new premium efficiency VSD was very lightly loaded or off. The fix was a simple adjustment of the target pressure of the new VSD, all done through recommendations from my office while watching on my computer screen.
The monitoring system also allowed a diagnosis of another problem. Due to the remote check valve, and a check valve within the associated dryer, the remote air compressor could not turn off on standby for more than a few minutes, even though it was not required to run during non-productive hours. The check valves prevented it from seeing the true system pressure, its local control pressure was being pulled down by dryer purge as soon as the air compressor turned off. A bypass line was installed to allow the air compressor to directly see line pressure, reducing its operating time substantially.
Excessive leakage and dryer purge were also detected by the system. This is being addressed by the maintenance department. Estimated operating cost savings for the combined adjustments here reduced the energy consumption by an estimated 10%, saving about \$10,000 per year in energy costs.
Quick Diagnosis, Adjustments Save Sawmill \$22,000 Per Year
The monitoring system was installed on a sawmill located about 1,200 miles from my office, where a VSD air compressor had recently been added to a system of three load/unload air compressors. The measurements were done on request by the local power utility since they were funding the system upgrade with a financial incentive.
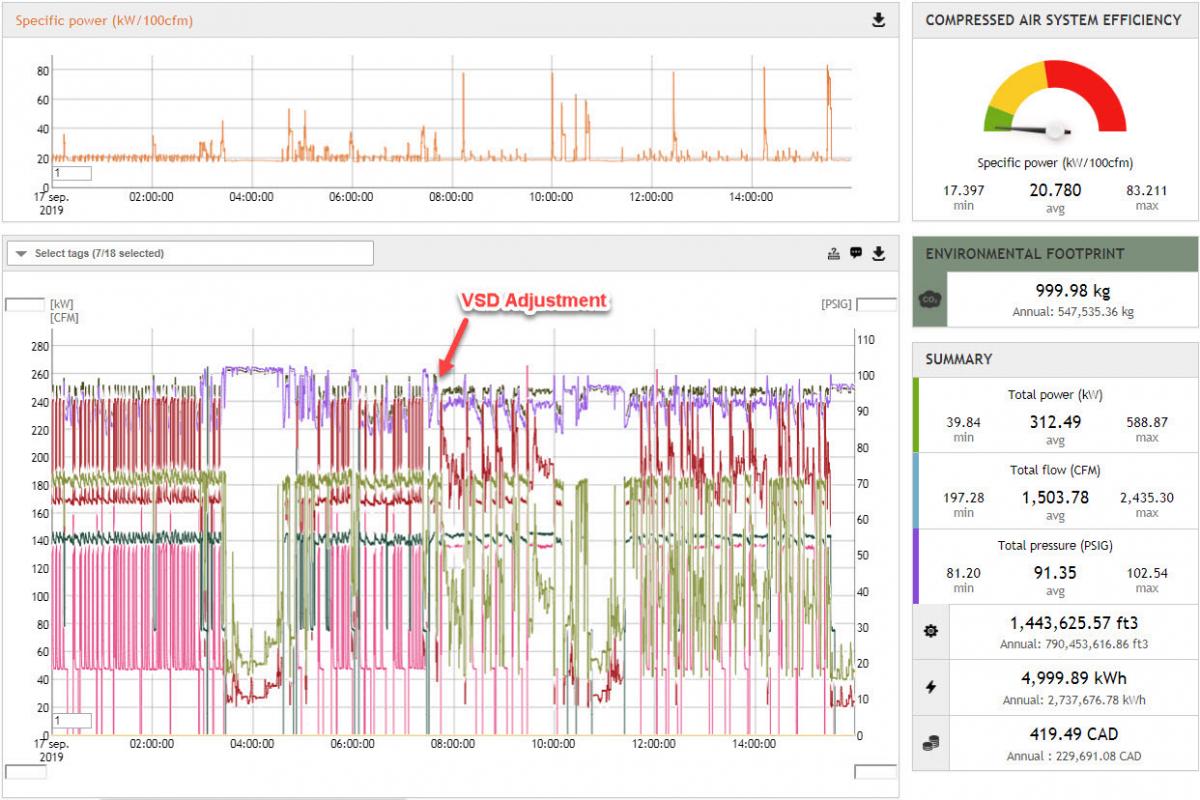
Figure 3: This chart shows the full dashboard of this sawmill system. The VSD air compressor was running at full load during full production causing a fixed-speed unit to load and unload. A change to the VSD setpoint improved system efficiency and the pressure profile (black and magenta traces). This dashboard shows at a glance if the system is running optimally. The air compressor load/unload status can be tracked (bottom chart) and the key parameters are shown for the sample timespan, as well as being projected to an annual span. The information even tracks the carbon footprint. (Source: CALMS Air.) Click here to enlarge.
On inspection of the installation, it appeared the pressure setpoint coordination was adequate, based on the air compressor setpoints, however, when the VSD historical data was viewed it looked like the VSD was spending very little time in its variable mode, it ran mostly fully loaded. Hour meter readings also showed two of the fixed-speed units had higher than expected unloaded power consumption.
A look at the data collected by the monitoring system (Figure 3) showed the VSD running fully loaded and fixed-speed units loading and unloading during plant production. This is opposite of what should be happening in an efficiently controlled system, the air compressor setpoints needed to be adjusted.
Had I used my standard loggers, I would have downloaded the data after returning to be plant, only to have been faced with another three-hour plane ride and four-hour drive to come back to verify the air compressor adjustments. But, because I could easily see the data, I could instruct the local operators to adjust the air compressor setpoints to a properly coordinated condition.
After adjustments, the VSD air compressor became the trim unit and the fixed-speed uints would go to full load, or when not required, would time out and turn off, which is typical of a correctly controlled multiple unit system.
The system dashboard (Figure 3) shows a full range of pressures, power, flows and energy costs, so it was easy to determine the adjustment of the air compressor saved an average of 25 kW of wasteful unloaded run time, saving about \$22,000 in annual power costs, not bad for a few minor pressure adjustments. The adjustments also helped stabilize the plant pressure, bringing it closer to the VSD setpoint, rather than having a constant saw-toothed waveform typical of a load/unload-controlled system.
It’s All About Efficiency
These brief success stories illustrate how useful Internet-connected compressed air data monitoring systems are in helping compressed air professionals very quickly assist their customers in becoming more efficient. The system is able to create pressure, power and flow baselines in each case, and automatically calculate system specific power. Based on these readings, and analysis of the time-based data, improvements can be recommended, often within a few hours of the request, and the results of the changes very quickly verified. Having a constant stream of live data available on the Internet saves travel time and money - and keeps customers happy and working efficiently.
For more information about this article, contact Ron Marshall, Marshall Compressed Air Consulting, tel: 204-806-2085, email: ronm@mts.net.
To read more air compressor instrumentation articles, please visit www.airbestpractices.com/technology/instrumentation.