Production complains about frequent work stoppages due to air supply related problems. It wants a more reliable consistent source of compressed air. Maintenance says it will need to replace an older compressor with a new one to improve the reliability and stability of the system. Maybe purchase a bigger one than currently needed in anticipation of future increases in air demands. Management wants assurances a good return on the investment will be realized from the expenditure before making a financial commitment. For comparing and evaluating alternatives, a benchmark must be established to determine the cost to run the current system. An assessment must be performed to identify the saving’s opportunities and assign dollar values. Questions about the cost of the assessment and what is to be expected in return need to be answered.
Outsourcing assessment services to a compressed air system expert is expensive. Companies with large plant air systems operating 24/7 can afford contracting with an outside resource because the potential dollar savings from a comprehensive assessment will be substantial. But small and midsized companies also need to address reliability and operating cost issues for their respective compressed air systems. These smaller companies compose 90% of the manufacturing establishments in the US and are a very important stakeholder in the compressed air market. The statistical data compiled in a Compressed Air Market Assessment-The Supply Side of the Market commissioned by the U.S. Department of Energy shows 72% of all facilities have 4 or less compressors. The majority of these operate less than 24/7. The potential return for these companies may not economically justify hiring an outside consultant. Alternative resources to assist in performing a comprehensive assessment need to be explored. These might include:
- Power Authorities.
- Compressor distributors.
- Compressed air equipment manufacturers.
- Independent auditors.
- Energy Management Companies.
- Government Agencies.
A good first step would be to get the air compressor network under control and operating efficiently. Options to look at include:
- Rearranging the cascading pressure schedule of the compressor network.
- Installing automated compressor sequencing.
- Rotating compressors in accordance with an energy algorithm.
- Adding a more efficient VSD compressor to the network, perhaps oversized to create a source of reserve energy from its excess motor capacity.
- Increasing air storage.
- Applying Pressure-Flow Control.
Start the evaluation process with a supply side assessment in the compressor room. The energy consumed by the compressors represents about 80% of the compressed air generating cost. Improving the compressor performance offers a significant cost savings opportunity. Also, a benchmark must be established for evaluating the available energy efficiency improvement measures. A business plan with specific goals needs to be developed for upgrading and improving the plant air system. Knowing the cost to operate the compressors is essential to the development and successful implementation of an overall plan.
For the companies with smaller systems, management may want to consider doing the work with their in-house personnel. In fact, the previously referenced Compressed Air Market Assessment shows 45% of the user respondents believe their internal staff has the capability to perform the study services. If they had the instrumentation and software tools to record the data, the assessment could be performed in-house. Assistance with the analytics, however, will probably require working with a compressed air specialist.
A number of compressed air specialists are offering services via remote networking over the Internet. The specialist pre-configures the instrumentation and sends it to the client to collect the on-site data. The instruments are then returned to the specialist for analysis and interpretation of the data. A Report is issued containing all the pertinent information presented in a format management can use in making business decisions about the air system.
One such program, called SCADAR™, offers a simple, low cost method of assessing the air system using advanced hardware, the latest software, and cloud computing solutions that enable the compressed air supply side to be quickly and easily audited. It is a compressed air analytical tool that lets small-midsize plants to perform the required data gathering using local or in-house personnel. A contracted compressed air specialist ships the preconfigured data loggers to the client and coordinates the project with on-site personnel via phone and the Internet. When the units are returned, the specialist performs the analytics using the SCADAR™ cloud computing software. The results are posted on the cloud for authorized personnel access and view. By eliminating the cost burden of a specialist’s on-site time and the associated travel expenses, the assessment service becomes much more affordable. Taking advantage of the cloud computing solutions is a quick easy way to perform the analysis and develop the visual presentation for management. Upgrades to improve the operating efficiency of the network can be quantified through simulations. Also, once the costs and savings opportunities in the compressor room are defined, a cost effective comprehensive compressed air system study plan can be devised for performing an expanded assessment of the total site specific facility.
The SCADAR™ Audit
Simplified analytic solutions streamline the compressed air system audit process. Single channel, battery operated definite purpose data loggers preconfigured by the compressed air specialist are packaged and shipped in protective transit cases to the jobsite.
Local service providers or in-house personnel install the loggers. At a minimum, the power consumed by the air compressors and the pressure profile in the compressor room are logged. Data loggers are also available, at additional cost, for recording other parameters to include demand side pressures, temperature, dew point, and flow. Data is recorded over a representative production period. The loggers are then disconnected, repackaged in the shipping cases, and returned to the specialist for uploading the data to the cloud computing platform. The specialist performs the advanced charting, graphing, simulations, and reporting of the logged data. The final Report is posted on the cloud for viewing by the client.
The Analytics
To initiate the audit, the client must first provide information about the project. At a minimum, the specialist needs to know its location, the contact person, and compressor models and their rated performance. To facilitate compiling the compressor specifications CAGI Data Sheets are available and can be accessed via the compressor manufacturer’s website using quick links.
The performance parameters needed for the eventual analysis are entered into SCADAR™. The cloud computing software organizes the information for transfer to the assigned loggers. The compressed air specialist structures the audit in accordance with the defined goals of the study. The loggers are now ready to begin their assigned functions.
The client receives the pre-programmed loggers and arranges for them to be installed on the appropriate compressor or instrument port. Loggers are manually started to record the data. After returning the loggers, the specialist uploads the data to the cloud and begins the analytical functions.
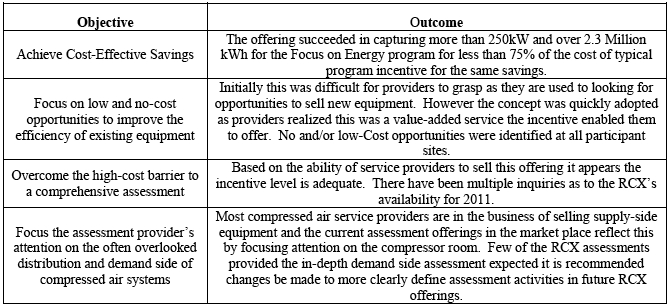
Charting Program: SCADAR™ populates a series of pre-defined tabular charts. The specialist can choose from a library of tables that display the compressor room profile. The sample illustration below shows the Compressor Power and Cost for both the 20 day audit period and the extrapolated annual totals.
Figure 1. Tabular Chart Illustration
Tabular charts are available for the specialist to display:
- Compressor operating hours and % loading.
- Compressor power and flow.
- Compressor hourly operating profiles.
- System power analysis
- Key Performance Indicators (KPI)
- System flow analysis
- System pressure profile analysis.
The specialist reviews the analytics and selects the appropriate charts, consistent with the scope of the audit, for inclusion in the final report.
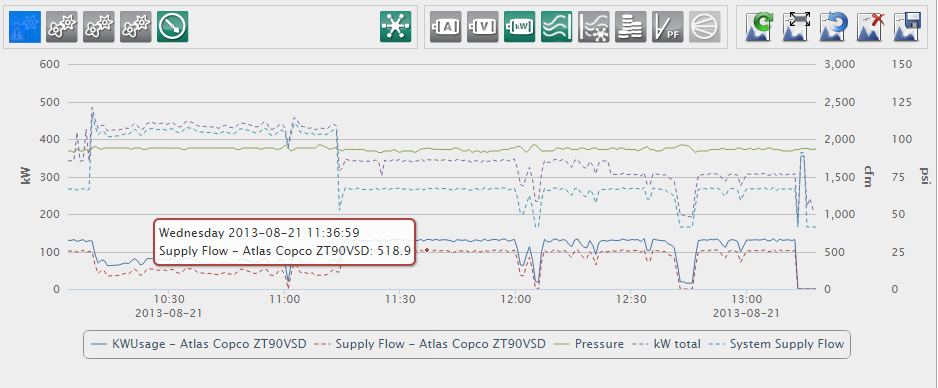
Graphing Program: Data selected by the specialist is also plotted for visualization in the form of graphs. Pre-defined formats are used to depict selected data. The Flow, Power, and Pressure sample audit data is graphed in Figure 2. It is plotted in one hour intervals over the full 20 day audit period. Figure 3 shows the same compressor with additional data plotted at 30 minute intervals. The logger’s sampling rate allows a graph resolution as low as 1 second intervals. Graphs can be combined as desired to enhance the presentation.
Figure 2. Graph over 20 day period
Figure 3. Graph at 30 minute intervals
Data available for graphical depiction include:
- compressor load profiles
- basic power, current, voltage, and true kW
- calculated or measured flow
- power factor
- CO2 emissions
- costs
Totalized system data can also be graphed.
Simulations: System control scenarios can be simulated to identify the predicted energy, cost, and CO2 benefits. The simulations demonstrate the potential savings from various actions applied to the benchmark profile. The results are shown in a tabular chart. Simulations compare the benchmark with a new profile from modifying the compressor configuration by:
- adjusting the cascade pressure settings
- removing or replacing an existing compressor
- adding a compressor to the existing network.
This is where maintenance can evaluate replacing the older, less reliable compressor with a new one. The impact on the operating profile of oversizing the new compressor can be determined. The benefits of a higher efficiency VSD compressor can be simulated. Comparing the benchmark operating costs with the reconfigured network operating scenarios lets management see the financial consequences after adjusting for the capital expenditures.
The application of a System Master Network Control to automatically sequence the compressors is simulated in Figure 4. The red graph shows the existing performance. The blue graph shows the predicted performance after the installation of the System Master Control.
Figure 4. The impact of installing System Master Network Control
The predicted savings comes to \$36,042 per year, which offers an excellent return on investment opportunity even after factoring in the expenses associated with the installation of the equipment.
The application of Pressure-Flow Control can also be simulated and the potential savings evaluated at different inlet and target outlet pressures. Figure 5 simulates adding a Pressure-Flow Control Valve to the original compressor network.
Figure 5. Applying Pressure-Flow Control
The estimated savings from adding the Flow Control Valve upstream of the two largest fixed speed compressors and downstream of the small fixed speed and VSD compressor comes to \$52,396 per year. Even after adjusting for the additional capital expense of installing a large receiver, the upgrade offers a good the return on investment.
The cloud computing Simulation program is valuable tool for management to use when making business decisions about the plant air system.
Publish Report: Relevant charts, graphs, and simulations are arranged by the specialist into a written Report for posting on the cloud. The specialist will upload images, add and edit text, and organize the content into useable information for the client.
SCADAR™ offers a simple, low cost method of assessing the true power cost to run the compressors. A benchmark is established for management to use in comparing and evaluating available cost saving measures. The cloud computing platform allows a qualified compressed air specialist to perform the analytics. The Simulation program allows various scenarios to be analyzed to determine the benefits of reconfiguring the existing compressor network. The impact of applying a System Master Network Control or Pressure-Flow Control can be evaluated. A Report is issued for the client and colleagues to use in future planning.
Summary
The energy required to maintain a stable reliable source of compressed air to production is the largest controllable expense in most manufacturing operations. That makes it one of the biggest saving’s opportunities. Since about 80% of the cost to run the air compressors is energy, it makes good business sense to address improving the performance of the compressor network as a first step in developing a more comprehensive overall plan. Large companies can afford to contract with outside sources to do the study work. Smaller companies may need to offset some of the study cost by using local or in-house personnel to perform the on-site work and outsourcing support services only as needed. In the end, the proper implementation of the assessment recommendations will result in a production getting a stable reliable compressed air supply, the new compressor maintenance wants, and the return on the investment management is looking for. It becomes a win-win situation for everyone.
For more information contact Bob Wilson, PEMCO Services.
For more articles on System Assessments visit www.airbestpractices.com/system-assessments/compressor-controls.
Illustrations courtesy of EnergAir Solutions Inc., USA.
The SCADAR Trademark is owned by EnergAir Solutions Inc.