A compressed air system assessment saved this building materials manufacturer over \$518,000 per year in energy costs, with a simple ROI of 11 months. Optimizing centrifugal compressor controls, replacing the air dryers, reducing air demand and installing a dedicated low-pressure compressed air system were the actions taken to achieve the results. Please note that due to article length constraints, this article only covers the portion of the system assessment dedicated to the installation of the low-pressure system. To achieve the savings numbers, all portions of the system assessment were executed.
The system assessment discovered that 2700 scfm of 105 psig compressed air was supplying the pneumatic batch transport conveyor system and the twelve air rings supporting the production lines. The energy savings solution was to deploy a dedicated low-pressure compressed air system designed at <55 psig. This portion of the audit project delivered savings of \$298,000 and energy savings of 3.1 million kWh.
 |
System Assessment of the Month |
|---|---|
| Where: | Western United States |
| Industry: | Building Materials |
| Issues: | Misapplied High-Pressure Air |
| Audit Type: |
Supply Side |
| System Assessment Win/Win Results* | |
|---|---|
| Reduction in Compressed Air Use: | 1,692 scfm |
| Approximate Annual Energy Savings: | $517,546 |
| Investment | $954,555 |
| Utility Incentive Rebate: | $481,339 |
| Net Investment: | $473,216 |
| Simple ROI: | 11 months |
*Annual energy consumption
|
Compressor System before Assesment | Compressor System after Assesment | |
|---|---|---|---|
| Operating hours: | 8232 hours | 8232 hours | |
| Power Cost kW/h | $0.09677 | $0.09677 | |
| Avg. Air Flow at 105 psig | 12,842 cfm | ||
| Avg. Air Flow at 100 psig: | 8,450 cfm | ||
| Electric Cost per Unit of Air: | $173.03 per cfm per year | ||
| Electric Cost per Unit of Air at 100 psig: | $171.03 per cfm per year | ||
| Avg. Air Flow at 49 psig: | 2,700 cfm | ||
| Annual Compressor Energy Cost: | $2,108,729 | $1,617,586 | |
| Annual Dryer Energy Cost: | $74,598 | $48,195 | |
| Total Annual Energy Cost: | $2,183,327 | $1,665,781 | |
Overall System Description
This facility produces insulation materials used in the building and construction industry. The plant runs 24 hours a day, seven days a week, with the exception of about 22 days per year (528 hours per year) for planned maintenance and repairs. Basic production is 8,232 hours per year. The blended electrical energy cost is \$0.09677 kWh. This rate is expected to increase next year, as the contract with the current negotiated rate will expire.
There are two primary production lines and each line has three production modules. At full production, all six modules are operating. Typically, there are five out of six modules in production with four (+) does this mean “or more”? Yes. compressors running. With the sixth production module on, there are usually five compressors running with the sixth compressor needed only once in awhile.
The single largest surge demand appears to occur when all the transport systems come on simultaneously. This surge in demand appears to be in the range of 1,500–2,600 cfm.
Current Compressed Air System Description
All the air compressors at the plant are 3-stage centrifugal units manufactured between 1985 and 1996. Units one through five all have 700 horsepower motors and inlet guide vanes. The sixth unit is also a 700 hp machine, and is the 1996 unit with more turn-down capabilities. A CCC controller and a target-pressure compressed air management system control all the units. All six units are well maintained and are going into blow-off once in a while. There is a tendency to run one extra unit on line because as the system demand spikes, plant personnel often cannot get fast enough response time to avoid production problems. Total scfm rated flow capacity at 110 psig is 17,894 scfm.
The compressed air is dried to a nominal 50 °F pressure dew point by two 6,250 scfm- rated chiller-type refrigerated air dryers and one 7,500 scfm-rated chiller-type refrigerated air dryer. Total scfm-rated drying capacity is 20,000 scfm @ 100 psig (100 °F inlet air conditions).
Measurement Actions Taken
The following actions were taken to establish baseline measures for flow and pressure:
- Temperature readings were obtained on all units using an infrared surface pyrometer. These were observed and recorded to correlate to the unit’s performance, load conditions and integrity.
- Flow, kW and pressure for all the compressors was analyzed using the logged data provided by the plant’s in-house data CCC monitoring system.
- Pressure readings were taken, including air compressor inlet and discharge, with Ashcroft digital test gauges.
- Discussions were held in detail with the appropriate operation in various units.
Transport System Creates Peak Surge
There is a significant surge demand event (2,700–3,800 scfm) from simultaneously running all sections of the transport system and fire ring system that often results in significant pressure pull down due to slow air supply response time. The pull down is from 110 psig–92 psig (pls confirm edit-ok) (18 psid). Other sections of the CCC data sets show pull downs as low as 78 psig (32 psid).The peak surge occurs randomly and usually lasts 7–8 minutes. The air system apparently reacts to the transport surges at least once every 12–45 minutes by first losing system pressure and then over-pressuring on the recovery, thereby raising the system pressure, which automatically increases the consumption and reduces the flow from the compressors.
This condition is caused by the system controls not reacting to the batching air demand in a timely manner. The primary cause for this is the turbulent-generated back pressure in the interconnecting piping.
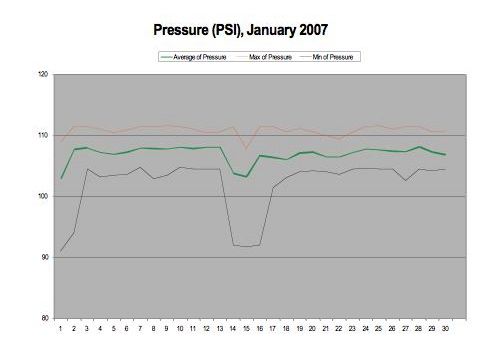
The table below displays the “Total Compressor Flow”. The large surge demands — upwards of 3000 cfm — are clearly visible. During the measurement period, the average compressor flow, including blow offs, was 12,730 cfm. The high variability and peaking is due to intermittent, yet significant, air demand from the transport and batch systems.
Because there is a relatively small level of blow off (224 cfm), the values for the “Total System Flow” closely approximate the air flow values for “Total Compressor Flow”. During the measurement period, the average total system flow, after eliminating blow offs, was 12,506 cfm. This represents a loss of about 2% to blow offs, which is relatively low for a centrifugal compressor-based system.
The overall strategy for improving the air system centers on the implementation of several air conservation projects, including replacing the use of high-pressure air with low-pressure air where possible. It is not efficient to use high-pressure air for very low-pressure applications.
We have identified two air flow transfer projects that currently consume 2,700 scfm in total. The projects are to convert the ring air and transport air systems from high-pressure (105 psig) to a new low-pressure (< 55 psig) system.
• Supply ring air from the new low-pressure air system 1,200 scfm
• Supply pneumatic transporter with low-pressure air 1,500 scfm
There are twelve “air rings” approximately 30" in diameter with 72 1/16" diameter holes. Each air ring is operating on high-pressure air (105 psig) reduced to 30 psig. There are two air rings in each module in the furnace area. This is a continual consumption of an estimated 100 cfm each, for a total of 1,200 scfm.
Pneumatic Transport System
This plant has an older dynamic air “dense phase” pneumatic transport system. It is a “full-pipe” type, which is designed to use low volumes of 40–50 psig air (up to 100 psig if required) to move the product through the transport conveyor piping at velocities from 100 ft/min to no more than 1,000 ft/min.
This type transport system has small “air-saver boosters” mounted along the conveyor piping to input short, small shots of air as required to control the natural solidity of the product column and to maintain appropriate compressed air pipeline velocity. The “air- saver boosters” are usually carefully set and controlled to optimize the expensive high-pressure air and not destroy the product column’s solid integrity.
Because of the generally abrasive nature of the material being moved, this system was selected to eliminate or minimize transfer piping wear (8" black iron pipe) by maintaining the design’s moderate velocities and still delivering an appropriate pound per hour of production. Generally, this type of system requires an air compressor of the appropriate size and pressure (35–50 psig).
The alternate choice of “dilute phase” pneumatic transport was also considered, because it is designed to run with 15 psig air, which can easily be supplied by a “blower” at a much lower electrical energy operating cost.
Dilute phase was rejected due to the highly abrasive characteristics of the product (particularly the glass and sand) and the necessary high velocities required (2,500 ft/min or more), which would create a significant transfer pipe wear problem, particularly at the elbows.
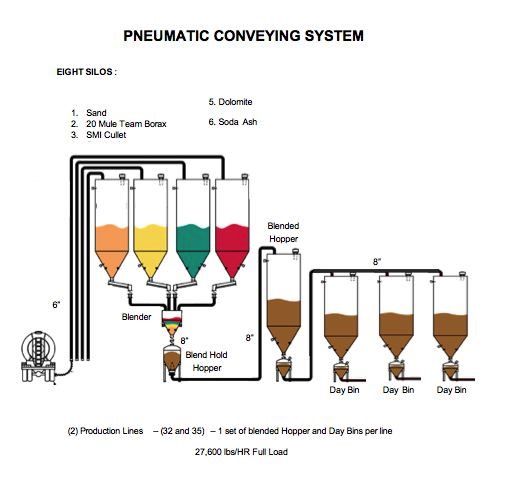
The Batch Transporter System
The pneumatic transport system fills the eight supply silos with the appropriate material to be mixed and sent on to the furnace for production. Gravity feeds the materials from the blend hold hopper in the basement. The products are then pneumatically transported to two separate “blender hoppers” through 8" lines. These are for the two production lines. From the blender hopper, the mixed batch is pneumatically transported to three “day bins” for each line, and then on to the furnace through 8" lines, as required.
At the current production levels, the batch transporter system needs to constantly handle 30,000 pounds/hour of mixture. In order to establish a two-hour cushion of supply in the day bins, the system must be capable of 90,000 pound/hour runs.
Over the years, in order to reach these required transport levels the basic system has been “adjusted”, particularly the air savers or boosters. These boosters are almost all running relatively open all the time, with feed pressures from 30–90 psig as adjusted.
Today, the measured average flow through the transport system is 1,200–1,500 scfm (velocity up to 1,200 ft/min) with sustained peaks of 2,600 scfm (velocity 2,000 ft/min) for 2–3 minutes and 2,000 scfm for 6–8 minutes.
These peak surge demands appear to occur at 10–45 minute intervals, with five to six similar events throughout each hour. The deep drops in pressure are caused by a lack of available compressed air at the time (due to the somewhat convoluted interconnecting pipe) and the response time of the control system.
The Solution
The recommendation is to remove 2,700 scfm of high-pressure air demand from the system and supply it with a new low-pressure air system. This would involve the installation of three 250 horsepower, low-pressure, single-stage, lubricant-cooled, rotary screw compressors, each of which can deliver 1,500 cfm at 37 psi and have a capability of 55 psig. Then, equip each unit with a TEFC motor, NEMA4 enclosure, Wye Delta starter and turn-down control system.
The system should also include a refrigerated, cycling-type air dryer for the transport air portion. The dryer should be sized to handle 3,000 cfm at 55 psi. These units will need a closed, evaporative cooling system.
The recommendation to run the transporter system primarily (pls confirm edit-no) on 55 psig compressed air is based on the information supplied by plant personnel and on the record that it now runs on 35–45 psig in the primary feed lines. Some of the air boosters are also run on low-pressure air, and others use high-pressure air feeds up to 90 psig, controlled manually by the operator. This project will require proper piping from the new low-pressure air supply to the primary feed tubes, and an alternate high-pressure air supply to the “boosters” as required.
The current high-pressure compressed air system averages 2,617.6 kW for 12,842 scfm during the main production period, which is 8,232 hours per year. Of this 12,842 scfm, the batch transport system represents 1,500 scfm and the fire ring air represents another 1,200 scfm. Both of these air uses are targeted to be transferred to the new low-pressure system.
Conclusion
This case study highlights an important air conservation project: replacing the use of high-pressure air with low-pressure air where possible. High-pressure air being used for very low-pressure applications is not an efficient use of energy. At this facility, 2,700 scfm of high-pressure compressed air (at 105 psig) was replaced by more efficient 55 psig air. This portion of the audit project delivered savings of \$298,000 and energy savings of 3.1 million kWh.
For more information, please contact Hank Van Ormer, Air Power USA, Tel: 740-862-4112.
For more articles for the Bulk Industry, visit www.airbestpractices.com/industries/bulk.