Quite often the typical variability in compressed air flow demand does not proportionately translate into power reductions at the air compressors. This can be a result of numerous problems with the compressed air supply system. It is important to understand the supply-side’s ability to respond to the demand-side of the compressed air system. If the air compressors, on the supply-side, are not able to translate flow reductions into energy savings, implementation of demand reduction projects should be re-evaluated.
How often are products pitched to plant personnel and touted as energy-saving because they can reduce the use of compressed air in terms of flow (scfm) and/or pressure (psig)? There are many very valid products and techniques (which we deploy during our audits) able to reduce compressed air demand requirements.
Reducing compressed air use, however, will not turn into energy-savings at the air compressors in a large percentage of installations we visit. Why? There are many potential reasons. The air compressors may not have the local controls permitting them to use less energy at partial loads. Or, the air compressors may be working simultaneously – all at less than optimal points in their efficiency curves.
Compressed air demand is always changing in plants. This is why the use of a central controller for the system can deliver high ROI’s with benefits extending to reliability and compressed air quality enhancements. A central control system is able to automatically respond to changes in compressed air system dynamics and provide the plant with Key Performance Indicators.
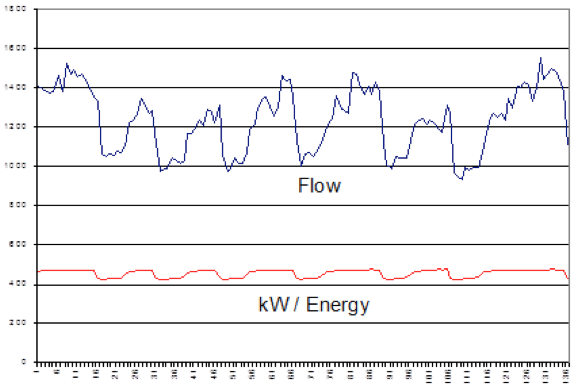
Figure 1: A common problem-this graph shows air compressors using roughly the same amount of energy, no matter what amount of compressed air flow is required.
The “Norm” is Multiple Air Compressors Working Individually
Here are our notes from what is a typical discovery process at an audit. We start with finding two air compressor rooms and begin figuring out what’s going on. Compressor Room #1 has several air compressors available for use to meet production demand. There are three 150-hp class single-stage lubricated rotary screw air compressors from two different manufacturers. One unit is air-cooled and two are water-cooled. The most efficient unit, Compressor #6, is used primarily as a back-up in case Compressors #1 or #2 goes down for repair. Compressor #6 is approximately 15% more efficient at full load then either Compressor #1 or #2. This unit, however, is quite old and its’ reliability is questionable.
Air Compressor Room #1 has two refrigerated dryers. One is an older refrigerated dryer from Brand “D”, rated for 1600 scfm. This unit was turned off and valved out. The second unit is a Brand A refrigerated dryer, sized for 870 scfm, and left to handle the total air flow from the air compressors. This dryer works for the current demand profile, but is vastly undersized should the full capacity of this compressor room be utilized.
Air Compressor Room #1 has a single 900-gallon receiver installed next to the dryers and a single point entry 1,060-gallon receiver located outside the compressor room, mounted horizontally on the wall. The single point entry setup does not work effectively to supply the system with storage.
Air Compressor Room #2 has three single-stage rotary screw air compressors; a75-hp class and a 50-hp class from Brand A and a 75-hp class from another brand. During our site visit, all of the compressors were running at some time with the 50 and 75 horsepower units from Brand A cycling on and off as needed. A Brand A sequencer was installed but had been deactivated – so the air compressors were all operating on local controls. All of the air compressors are operating in online / offline control.
There are no compressed air dryers in Air Compressor Room #2. All the compressed air leaving this area is saturated with moisture and mixes with the dried air leaving Room #1. There are no filters installed to remove oil or solid particulates. Saturated compressed air is sent from Room #2 to the receiver tanks located in Room #1.
All of these single-stage rotary screw air compressors use two-step controls. Two-step unloading is where the air compressor is fully loaded or unloaded (idling) - without actually stopping and starting the compressor, so there is no motor heat buildup problem. To work well, this type of control requires 3 to 5 gallons/scfm of effective storage. This control strategy is also known as load/unload or online/offline. The most important variable here is the blow-down cycle – how long does it take to reach idle (in seconds) after switching to unloaded?
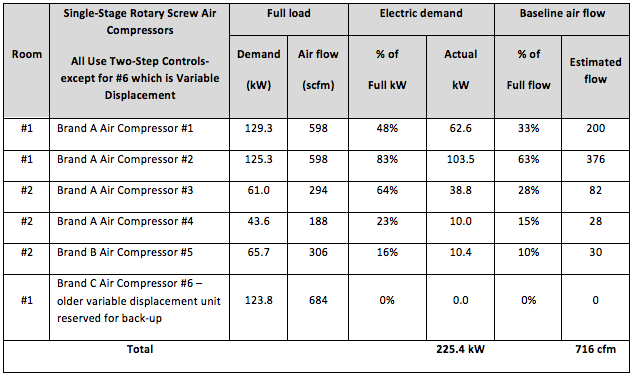
Table 1: A typical scenario-five air compressors working on their own do not optimize energy efficiency opportunities and can lead to reliability issues.
The “Norm” is System Dynamics are Always Changing
The one thing you can count on, from a compressed air system, is that tomorrow will be different from today. The system requirements will likely be dramatically different 1 year from now. This means compressed air flow (cfm) requirements may be higher. Perhaps a new production line was added. Perhaps three 1/2” links blew open, tucked away under some production equipment, and no-one has detected them. Perhaps flow requirements are lower due to a loss of business or an excellent compressed air leak survey (and repair). Perhaps the plant energy engineer has successfully reduced plant pressure from 110 to 90 psig by isolating one guilty high-pressure user and servicing it with a booster. Whatever the future might hold, one must plan for change.
The system described was running multiple air compressors in part load conditions. This was partially due to piping restrictions. Once the piping is reconfigured, the set points can be cascaded in a manner that will operate fewer units unless otherwise required by the compressed air system. A central control system will help ensure proper set points are maintained.
Pressure dewpoint was not monitored. During production days, we measured an elevated dewpoint due to the mixing of treated and un-treated compressed air from the two air compressor rooms. During the weekend, the pressure dewpoint dropped to 38 F as the compressed air came only from Air Compressor Room #1. A central compressed air controller will monitor and report any variations from the compressed air quality specification – triggering corrective actions.
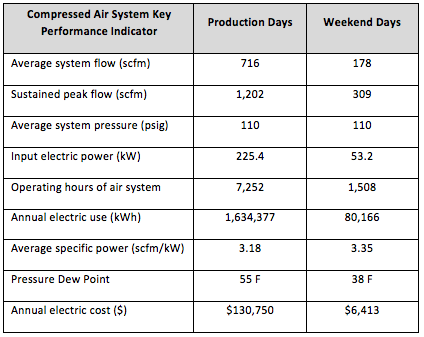
Table 2: These are the Key Performance Indicators we measured manually when we visited this plant. An instrumented master controller will provide this information year-round.
Air Compressor Data Required to Evaluate the Supply-Side Project
Supply-side projects will increase the overall efficiency at which compressed air is delivered to the plant. The decision of whether or not to add a Central Control System will be reached after evaluating the pre-project power consumption, as shown in this article, prior to implementing any of the supply side projects. Second, the most likely post-project compressor operation pattern is established by considering:
- Which compressors are regularly available for operation and which are getting old
- Their individual full load capacities and specific powers
- Their capacity controls
- Whether or not each compressor has an auto-start and auto-stop capability
- The likely idle time at an unloaded power level before being fully turned off
- The pre-project load demand profile.
Benefits of a Central Compressed Air Management and Monitoring System
A central compressed air management system offers several advantages, the primary being to improve air compressor specific power (kW per cfm) by ensuring the constant optimum air compressor selection and the elimination of excessive pressure loss. A central compressed air management system can also:
- Establish and monitor proper compressed air quality throughout the system
- Reduce average compressed air demand by implementing the myriad of air conservation programs and monitor the actual demand levels on a continuing basis
A central control system will allow fewer air compressors to operate at a given time as well as smoothing out the air produced by the compressed air system.
In the example given in this article of the two air compressor rooms with six air compressors, the projected improvement in specific power (at the same demand with the same compressors on- line) is from the current 3.17scfm/kw (716 scfm/225.4 input kw) to a projected 3.76 scfm/kw (716 scfm/190.3 input kw). An improvement in compressed air efficiency of about 16%. This would yield a projected electric operating cost savings of \$21,000 to \$22,000 per year.
Without considering other savings such as lower maintenance costs and repair costs - this is a 24 – 27 month simple payback. These type monitoring and control systems can be added in steps over time to lessen the annual capital investment over time. This project will also allow any reduction in compressed air demand to generate a commensurate reduction in input energy.
Instruments Deliver 5 Key Performance Indicators
A compressed air monitoring system will enable the plant to track air system performance and energy efficiency levels on an ongoing basis so energy savings achieved in the proposed projects can be maintained over time. The primary elements of such a monitoring system such as the location of recommended flow, kW, and pressure meters are listed below. At installations such as the one we’ve profiled in this article, we also review where to install monitoring points in the air compressor room(s) and in the factory to optimally control the air compressors with a central control system. The Key Performance Indicators to monitor are pressure, flow, dew point, and individual compressor power.
The recommended elements instruments, for this project, to support a comprehensive monitoring system included:
- (6) kW demand meters on each individual compressor -- \$1,500 each for a total of \$9,000
- (12) PSI transducers (7 in the compressor room and 5 out in the plant) -- \$200 each for a total of \$2,400
- (1) Compressed air flow meter -- \$3,000 each
- (1) Dew Point Demand Meter -- \$2,500 each
- (2) Data Integrators -- \$5,000 each for a total of \$10K
The total price tag for the monitoring system equipment was \$26,000. Installation cost were projected at \$20,000 for a total cost of \$46,000. This instrumentation would then provide the Central Compressor Control System with the information required to deliver these Key Performance indicators:
- Flow levels over time (e.g., upward trends could indicate increased leak levels)
- Individual compressor kW readings (e.g., upward trends could indicate compressor malfunction)
- Basic System Efficiency over time -- Specific Power defined as Flow / Total kW demand (e.g., upward trends indicate loss in efficiency)
- Dew Point Levels (e.g., upward trends indicate increased moisture levels and possible air treatment equipment malfunction)
- System Pressure (e.g., erratic pressure levels could indicate insufficient air supply capacity; excessively low levels could be harbingers of production equipment failure)
Conclusion
Compressed air systems are dynamic – they are always changing! Central control systems, supported by instrumentation and an understanding of the individual air compressors, can automatically respond to these dynamic conditions and ensure optimal performance. Key Performance Indicators can be selected and then the performance can be managed with once-a-year “check-up” reviews ensuring the system is maintained optimally.
For more information, contact Don van Ormer at don@airpowerusainc.com or visit www.airpowerusainc.com.
To read more rticles about Air Compressor Technology, please visit www.airbestpractices.com/technology/air-compressors.